
Workspaces — A flexible solution that enables users to collect, analyse, navigate, and collaborate on their data.
The problem
Many customers had reported that the current platform interface was not intuitive or user-friendly, and that they often struggled to locate and access the features they needed. This resulted in frustration, confusion and inefficiency for customers, who expected a smooth and seamless experience from the product.
I was responsible for
- User research
- Design direction
- Prototyping
- Interaction design
- UI design
— Background —
The current platform gives customers a view of their IT assets and their performance so they can optimise their SaaS, cloud and software spend to maximise their return on investment (ROI).
This enables customers to save money and time by using the platform to manage their software subscriptions, cloud services and IT infrastructure. The platform also provides insights and analytics on how their IT resources are being used and how they can improve their efficiency and productivity. By using the platform, customers can make informed decisions and get the best value from their IT investments.
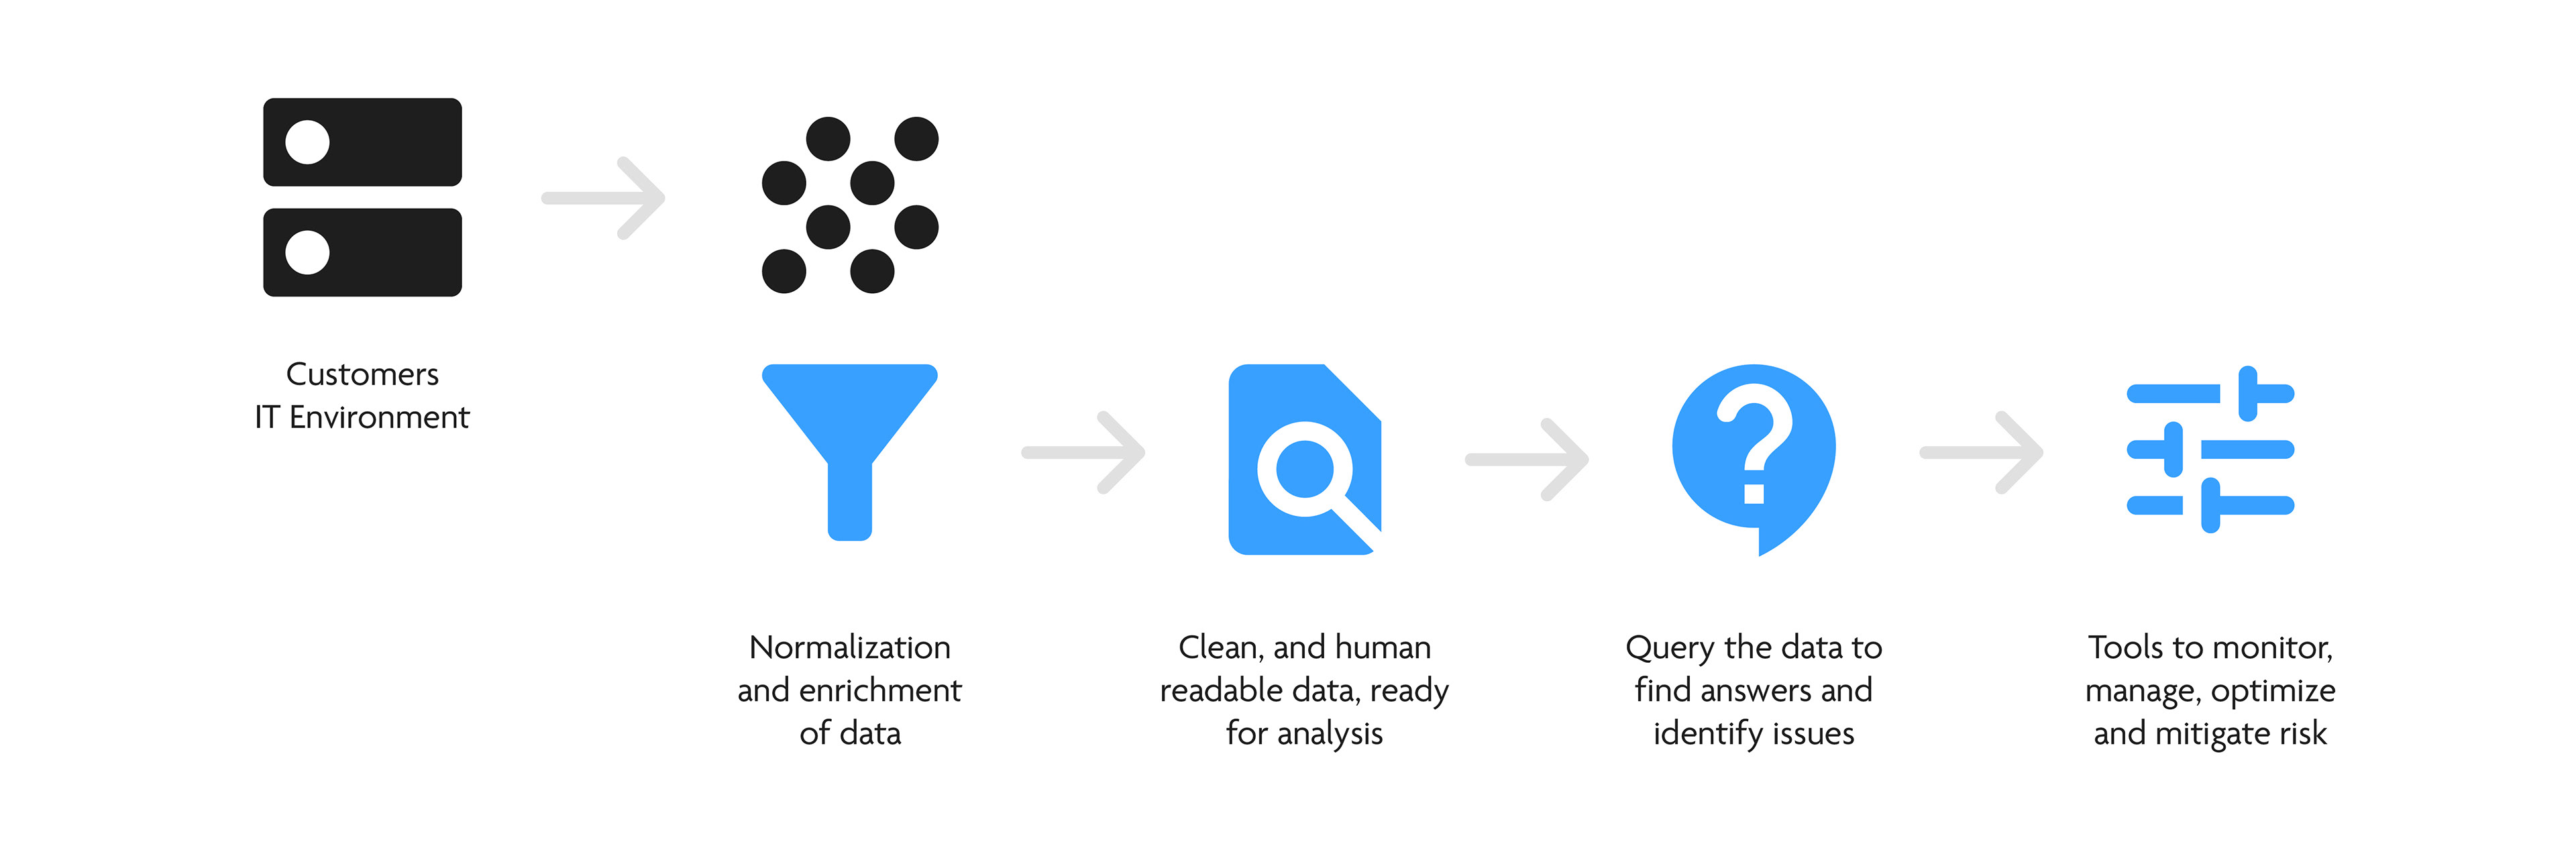
The platform consists of four main components: data ingestion and enrichment, data processing, data storage and data management.
— My process —
— Research —
I analysed the customer feedback that the product team had collected, and then conducted some further research sessions with customers to get a better understanding of the issues they were experiencing.
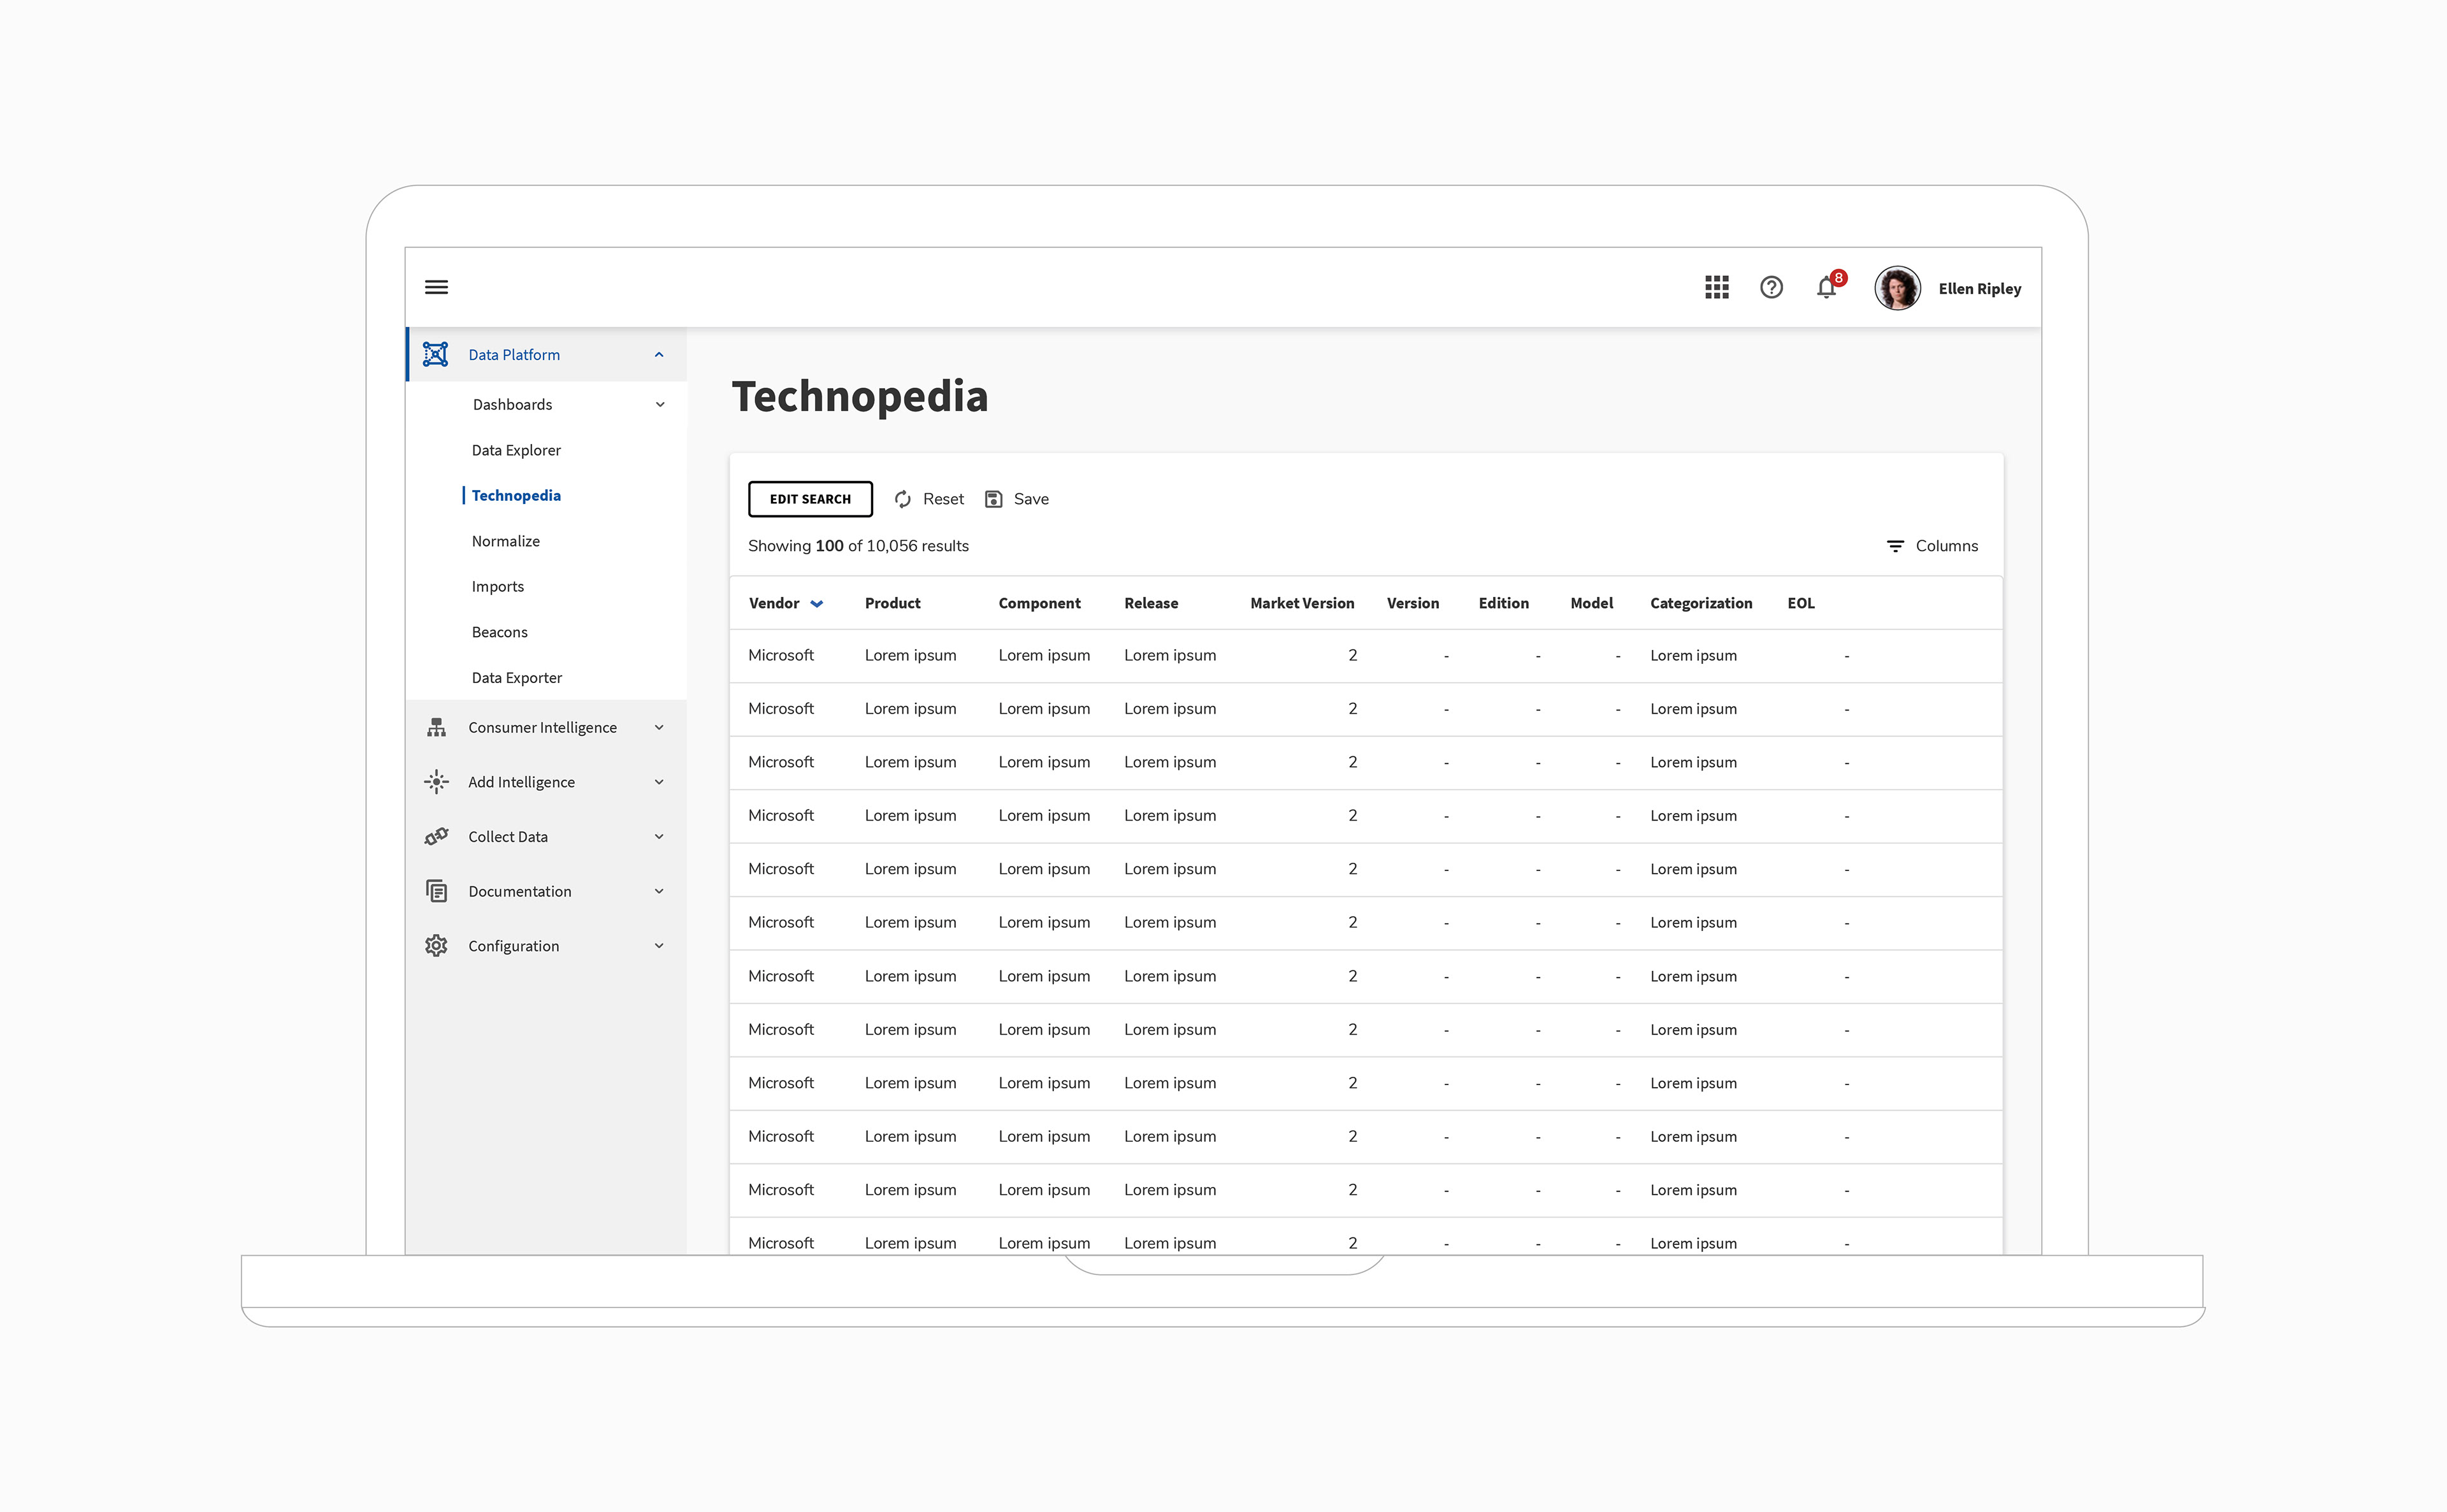
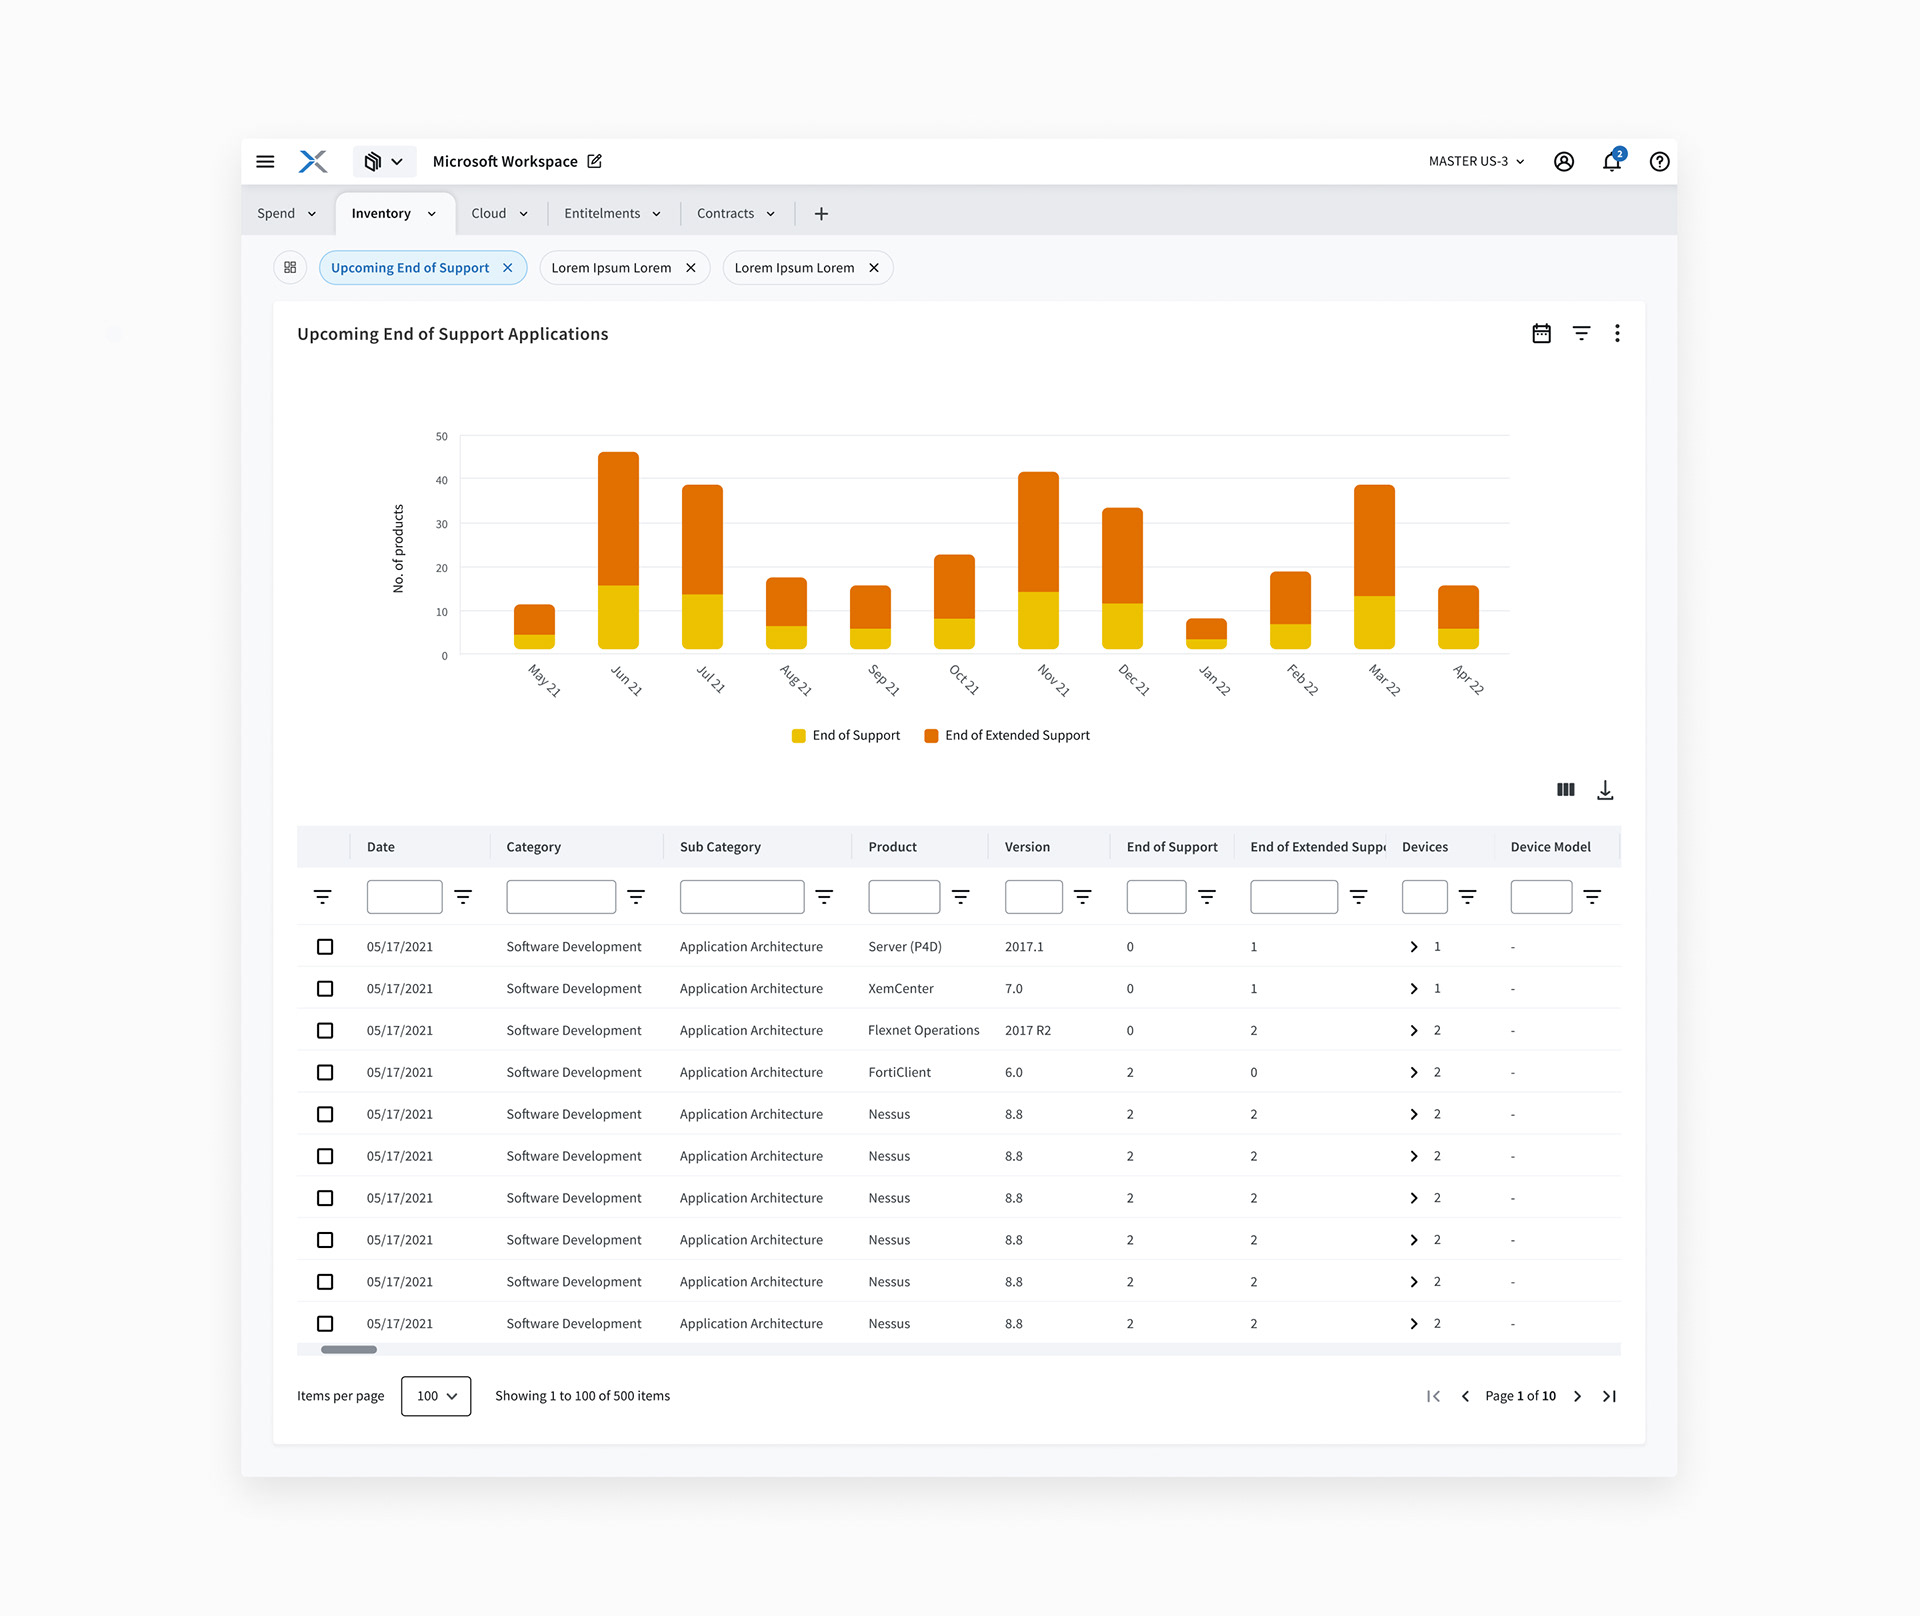
Below is an example of the platforms existing user interface.
Main customer pain points:
1. Difficult to find menu items.
Some customers complained that the menu was too cluttered and they could not locate the items they wanted easily as they were buried in submenus.
This lead to frustration for a lot of customers. Those that had experienced this, felt the product was of low quality and it caused them to lose trust in the overall product.
2. Sometimes pages wouldn’t load when the navigation link was clicked.
This resulted in more frustration, with some customers abandoning the website or refreshing the page multiple times.
3. No quick way to find items.
Some customers wished there was a search function or a filter option to help them narrow down their choices. The menus are so vast it's hard to find what you want. Most users had resorted to using web browser favourites to bookmark frequently accessed pages.
Product team requirements:
1. A navigation that has a "WOW factor"
2. A new UI style that indicates to customers that the interface has changed
Design goals:
1. Improve navigation Interaction
2. Incorporate a search function
3. incorporate a bookmarking or custom navigation feature to help users quickly find navigation items
4. Surface important insights directly to the navigation
5. New UI style
— Initial design concept —
Prototype 1
New navigation pattern and animation.
User testing
I conducted user tests with customers and observed that they frequently wanted to switch between features to run reports and download data. This suggested to me that there was a deeper problem to solve. What was the purpose of downloading data from different features? How were customers using it? How could the platform better meet their needs?

Am I solving the right problem? Is there a deeper problem?
— Design pivot —
Hypothesis
I believed that customers wanted to combine data from different features in the platform, so they could gain more comprehensive insights that addressed their specific business needs, and a new navigation would not solve that problem.
New research and analysis
To understand what customers need from their data, I analysed a research report that the company had previously conducted via a third party. I categorised all the customer feedback by common words or phrases to find themes. I then ranked the themes by the frequency of the feedback they received to gauge their level of importance.
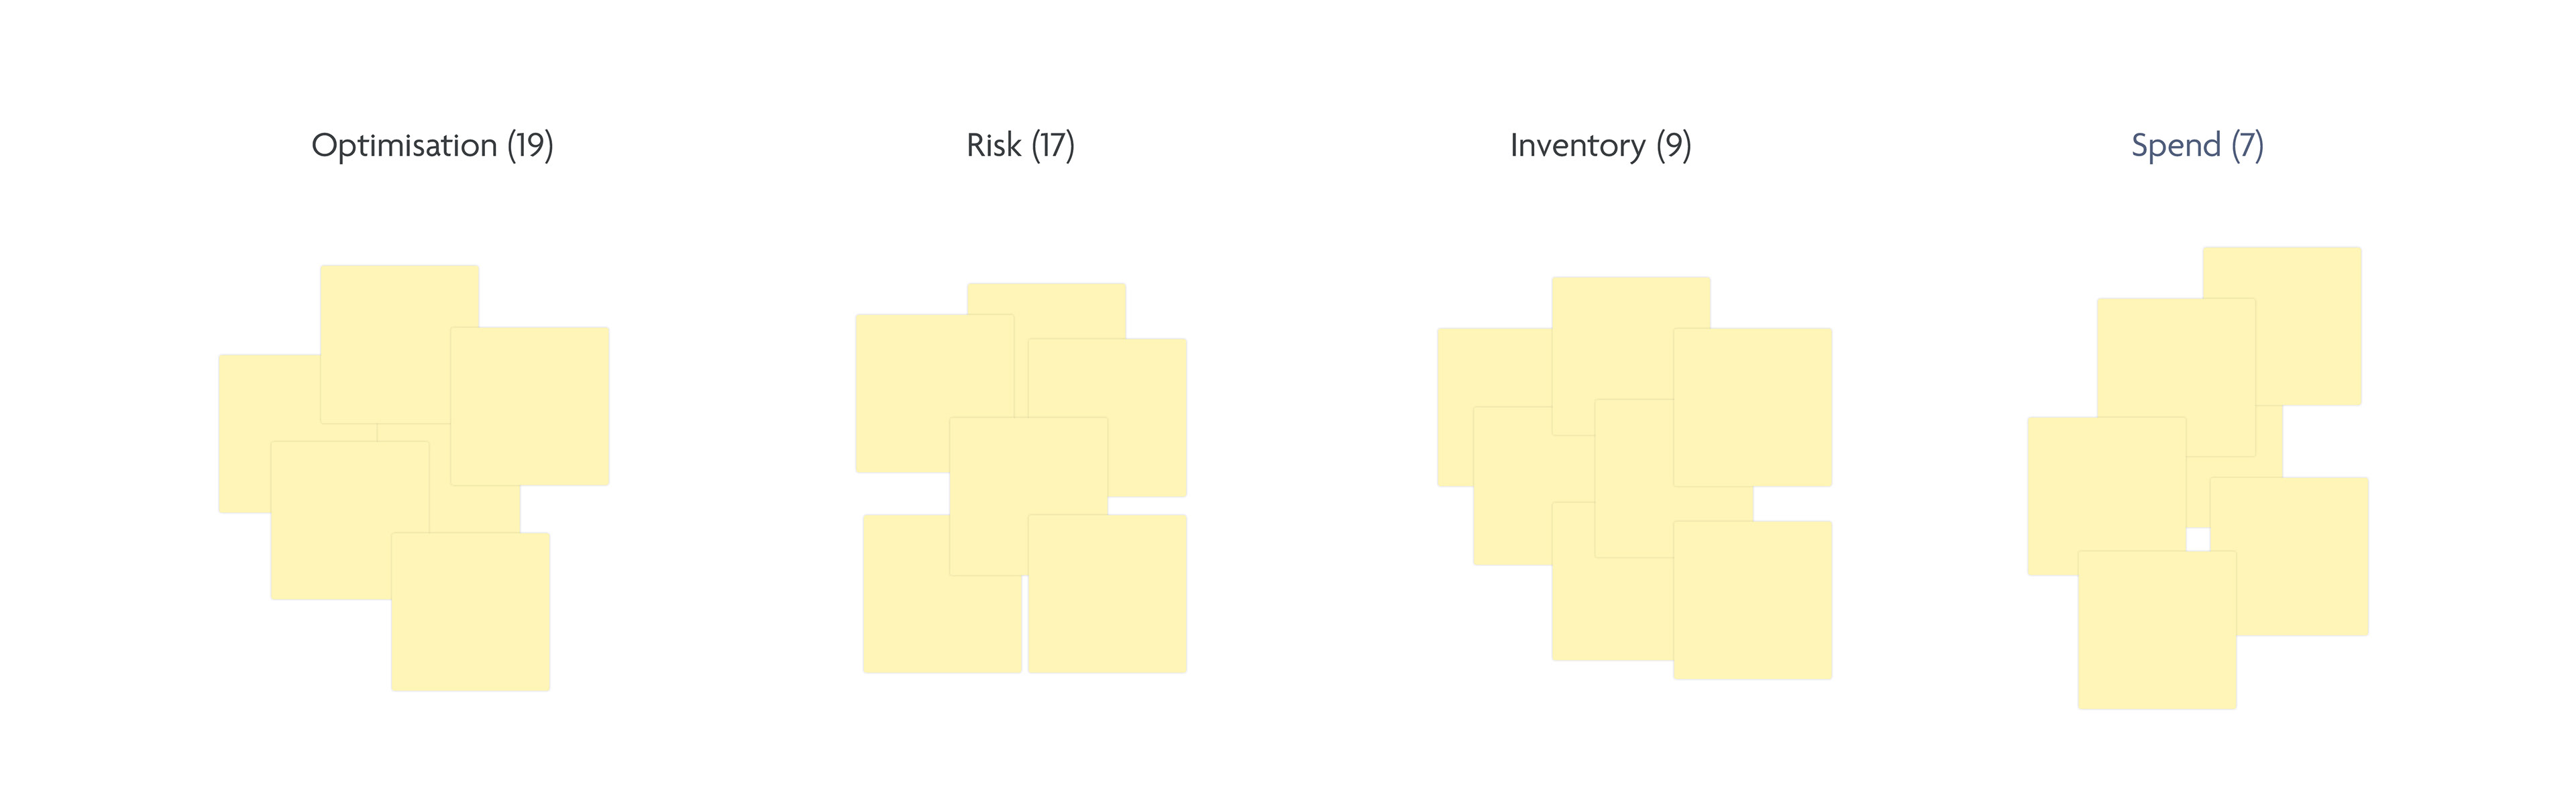
What I learned
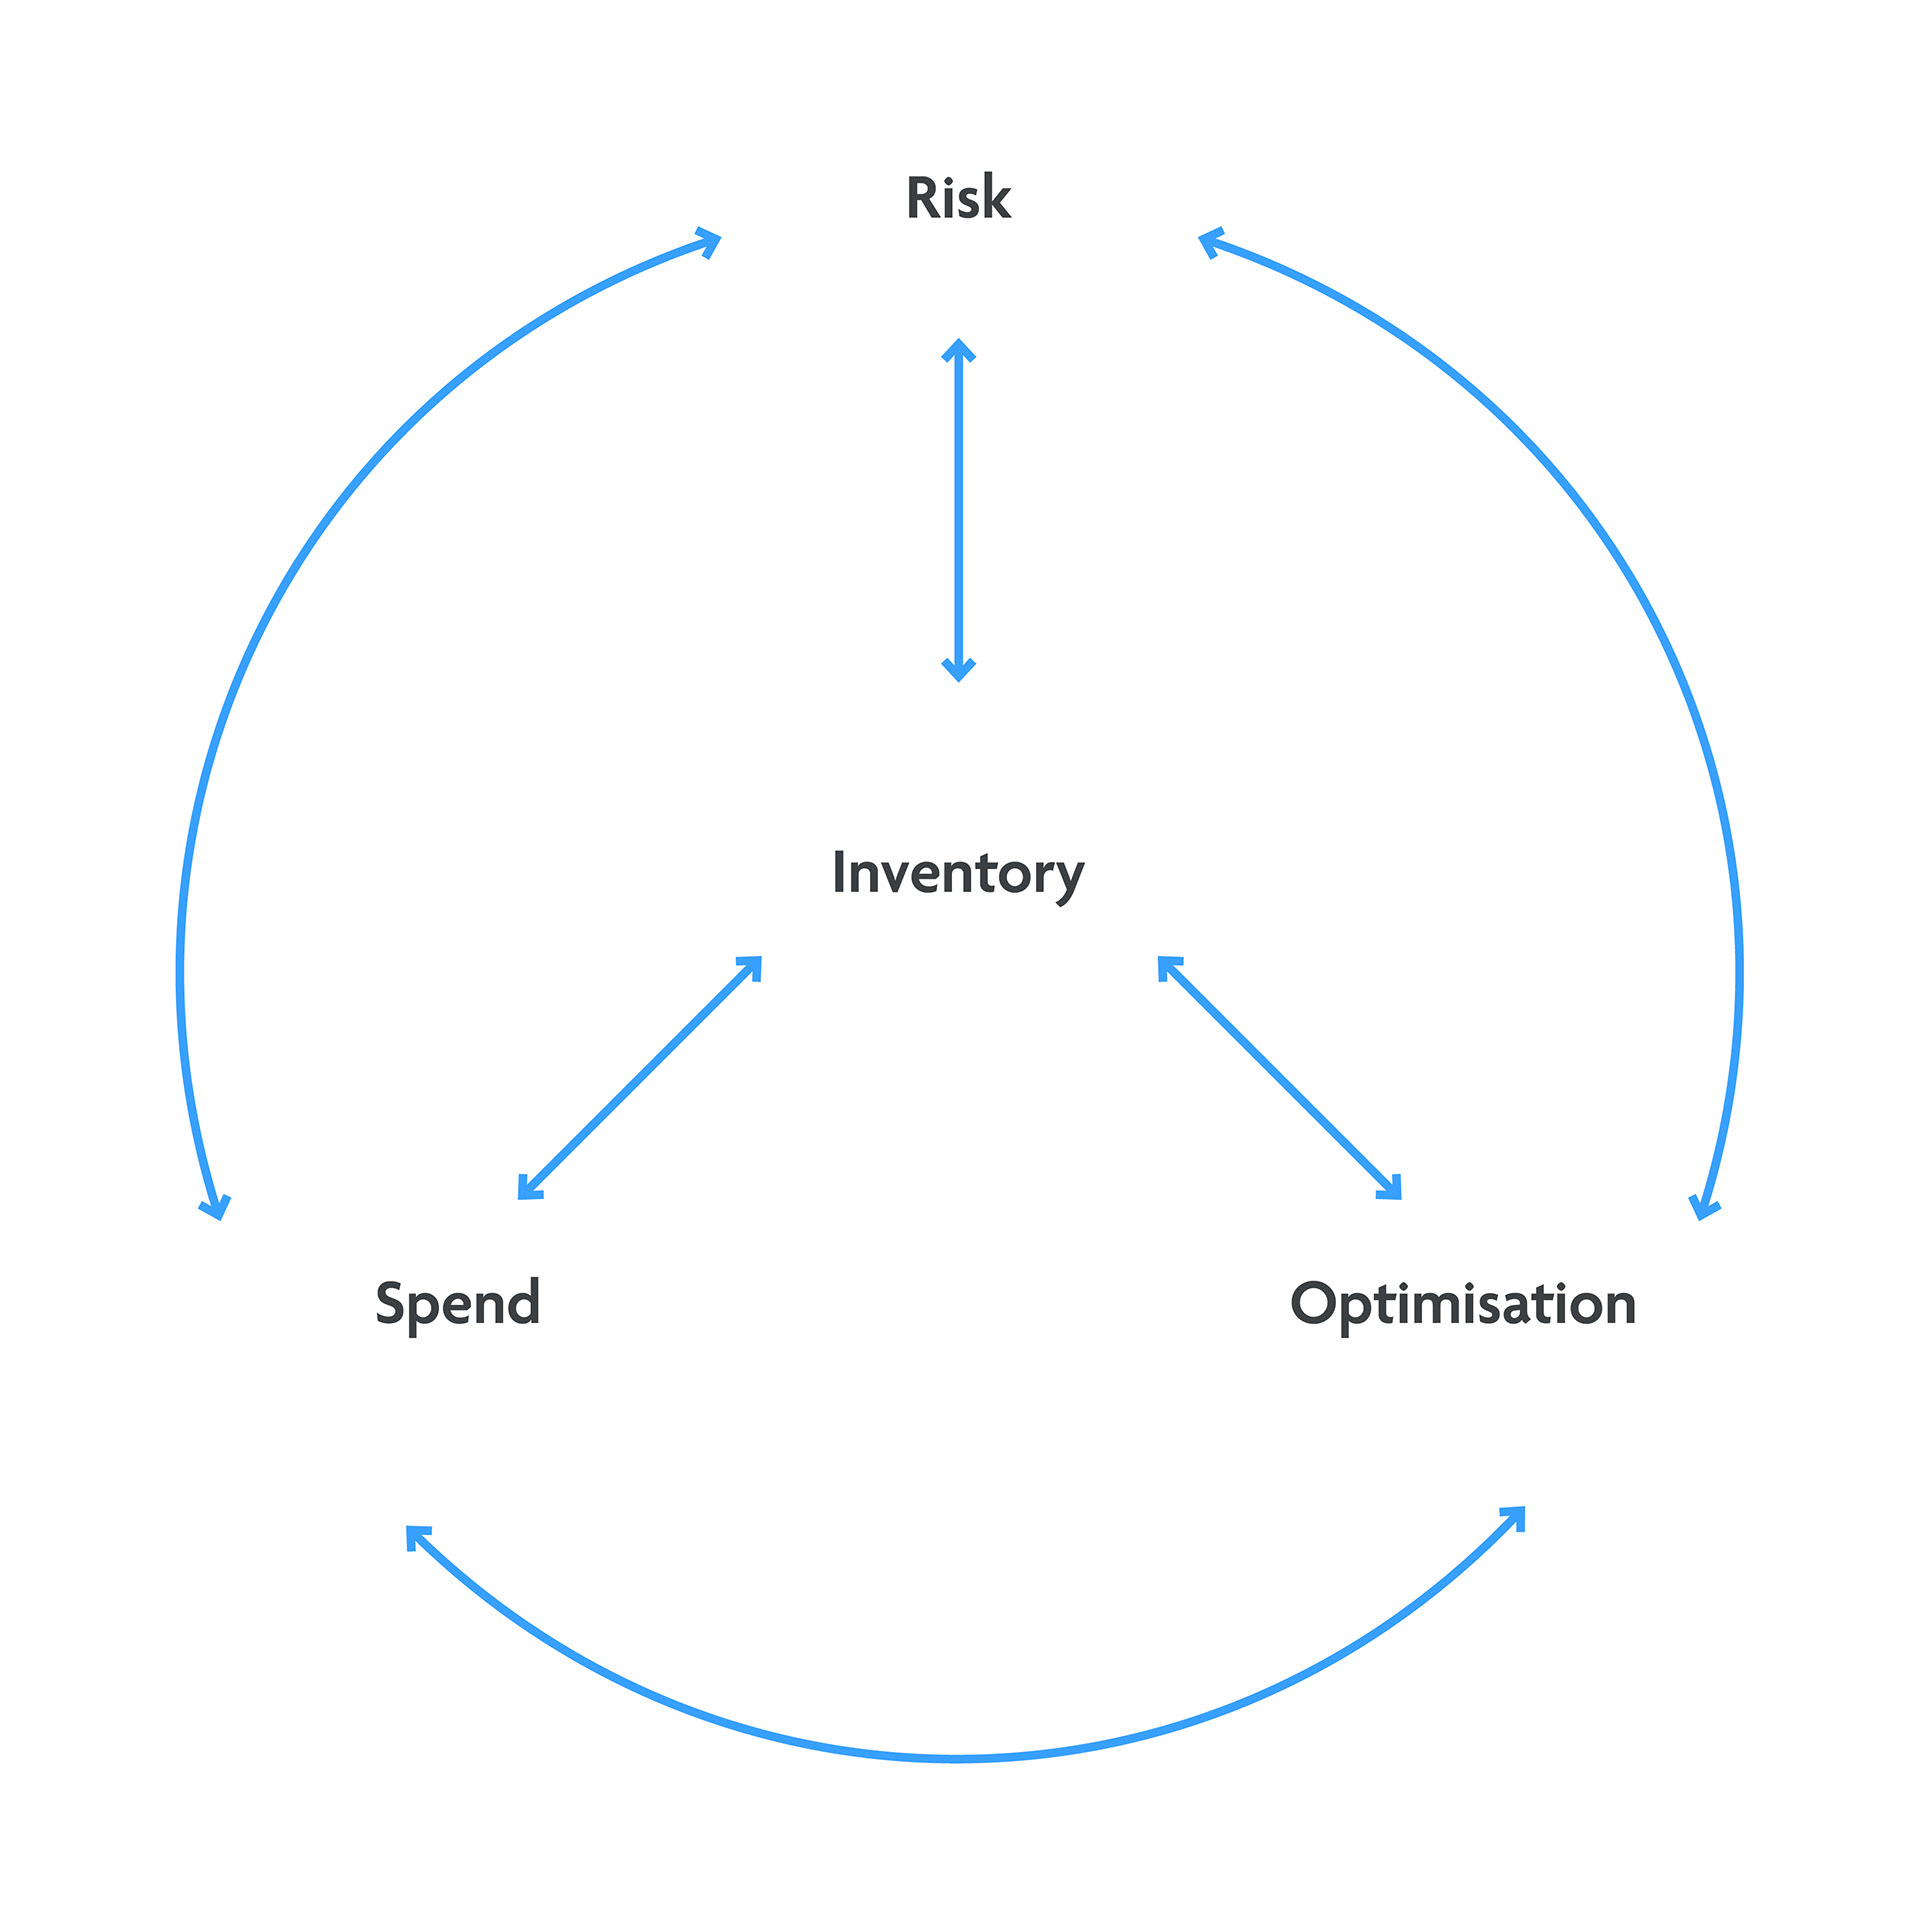
One of the main findings from the analysis was the connection between the data in the themes. The data all centred around inventory, such as the quantity, location, and status of the items. By combining data sets from different themes, users would be able to identify different patterns and insights that could help them optimise their inventory and reduce costs.
Example insight
Insight 1 = Number of Adobe Photoshop installs = 50
Insight 2 = Number of Licenses for Adobe Photoshop = 40
Insight 3 = Number of inactive users = 20
Insight 4 = License cost = £20pm
Insight 5 = License type = Annual
Insight 5 = Renewal date = July 2022
Actionable insight
Save = £4,800 a year
Risk = Remove 10 obsolete product installs
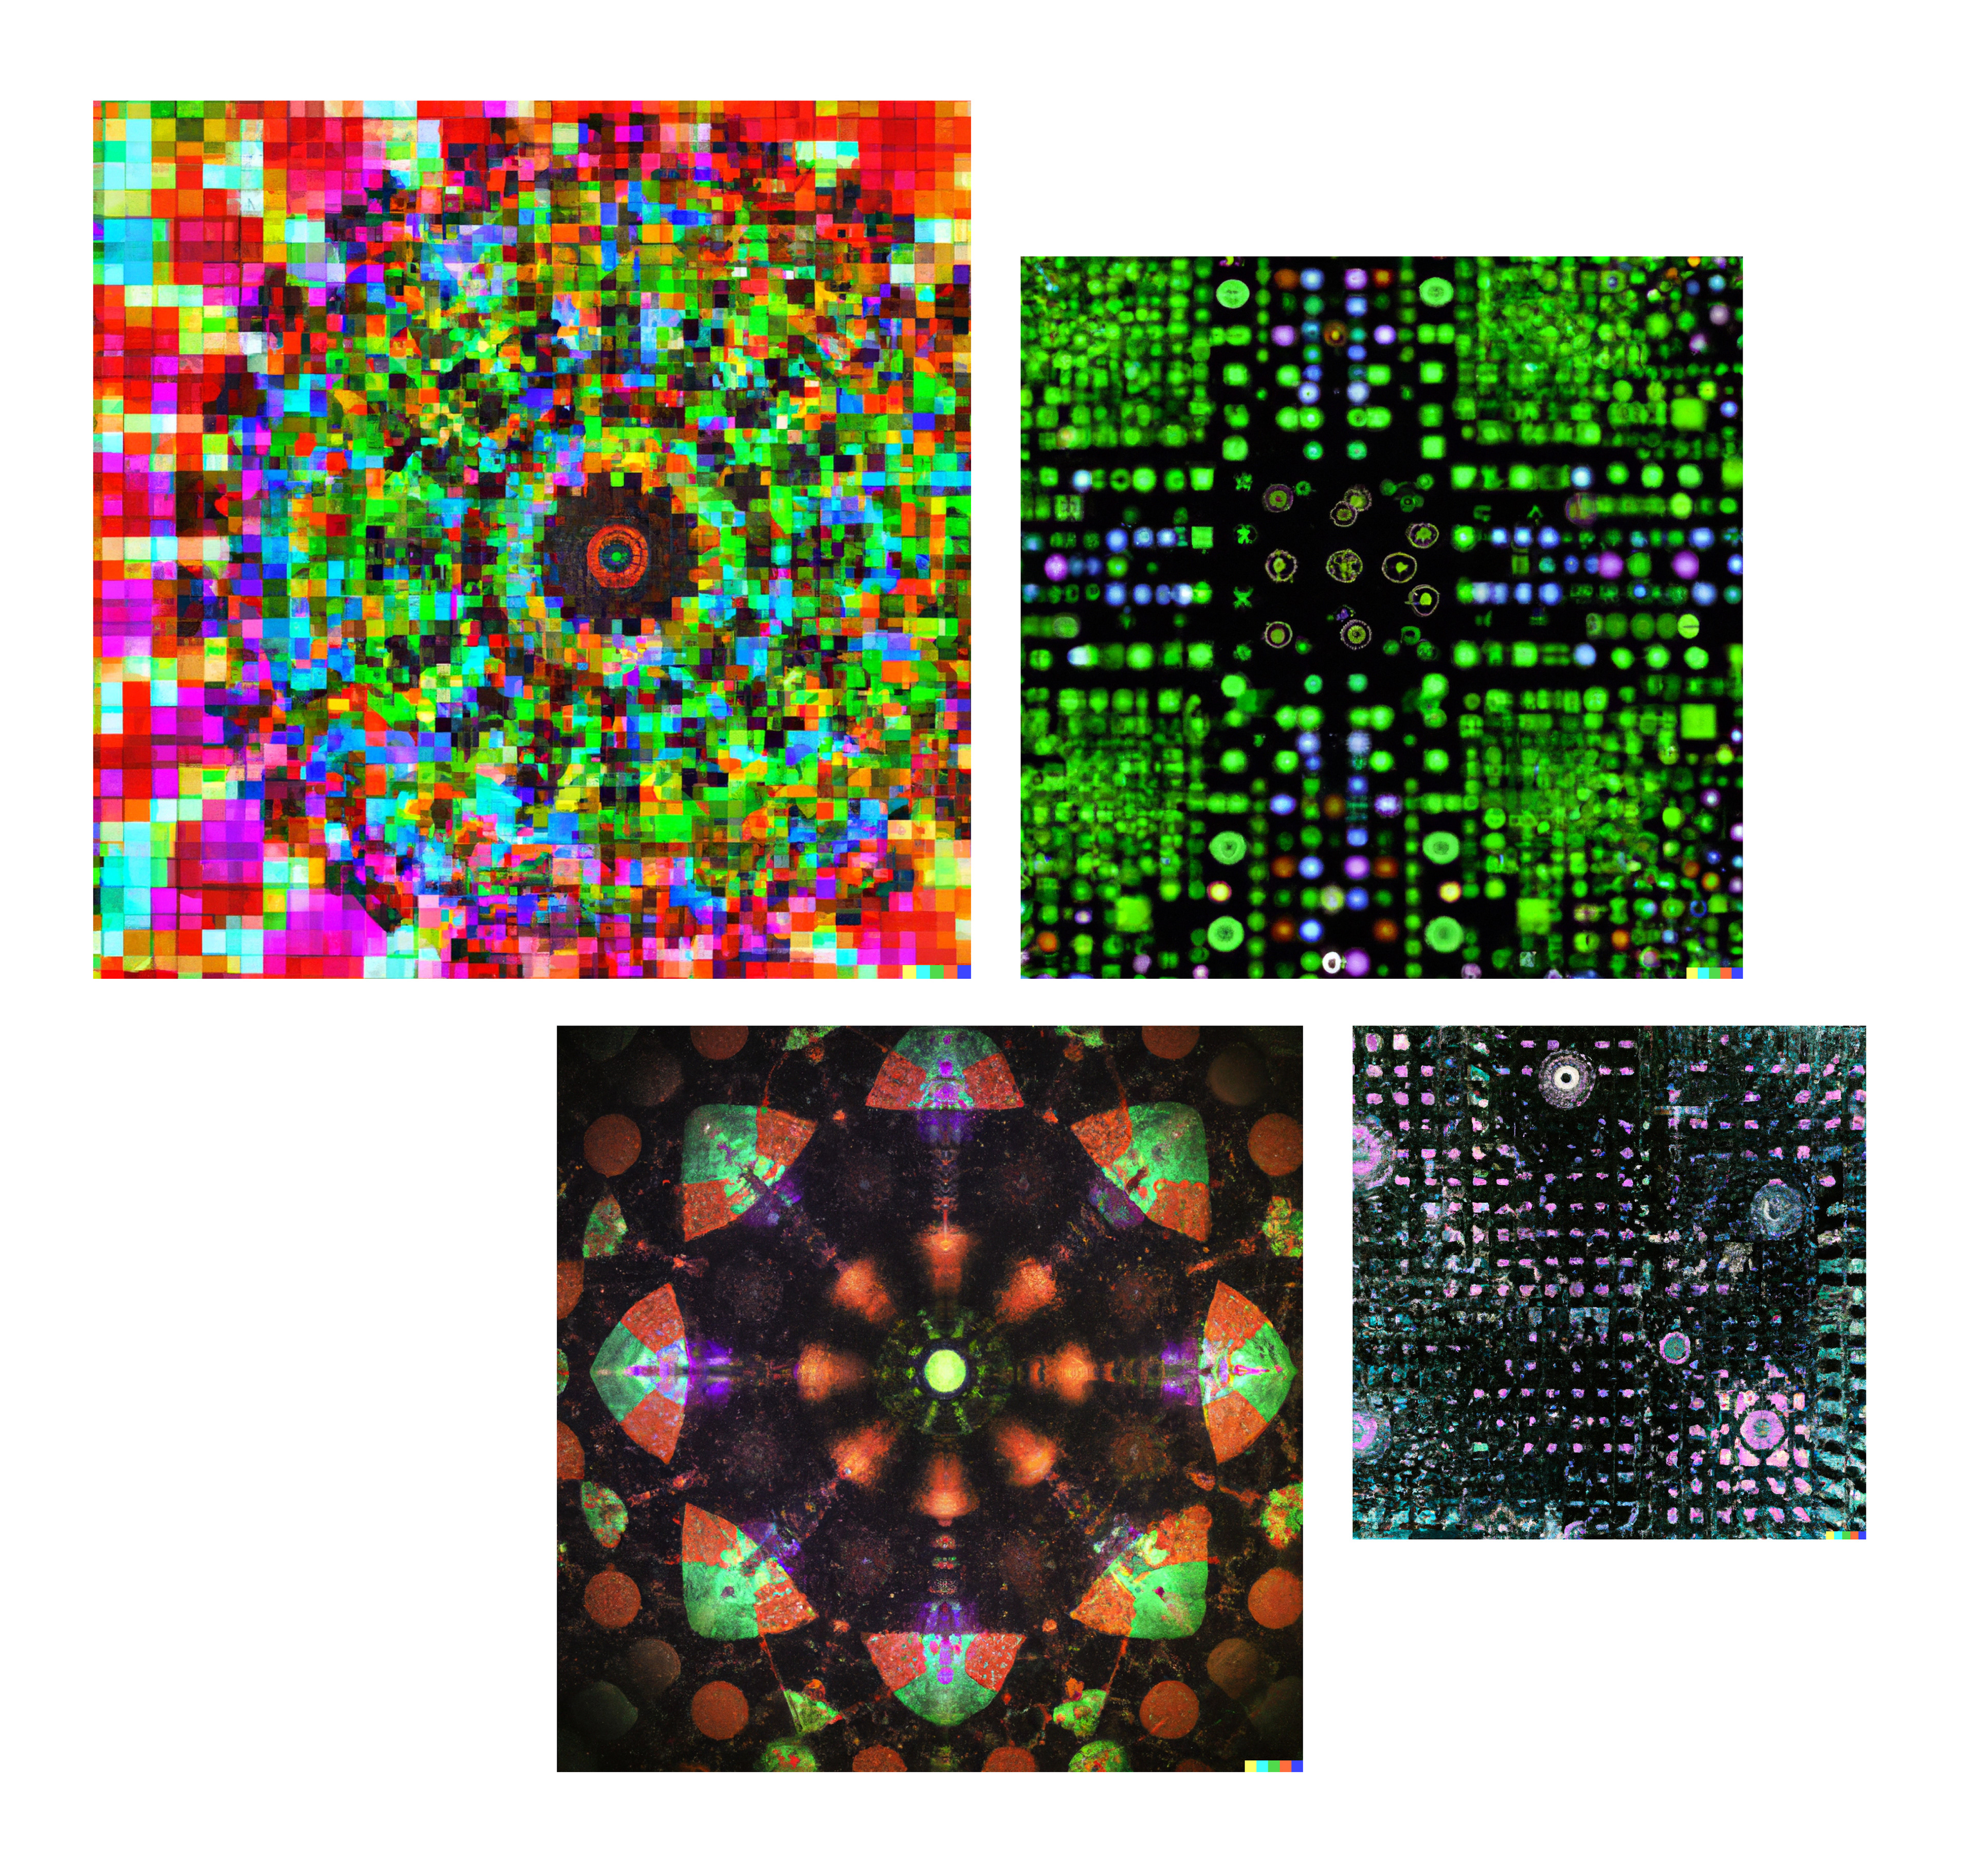
Think of it like a kaleidoscope...
Mixing the data from different features within the platform enables the user to visualise the data in real time and identify different patterns or trends.
For example
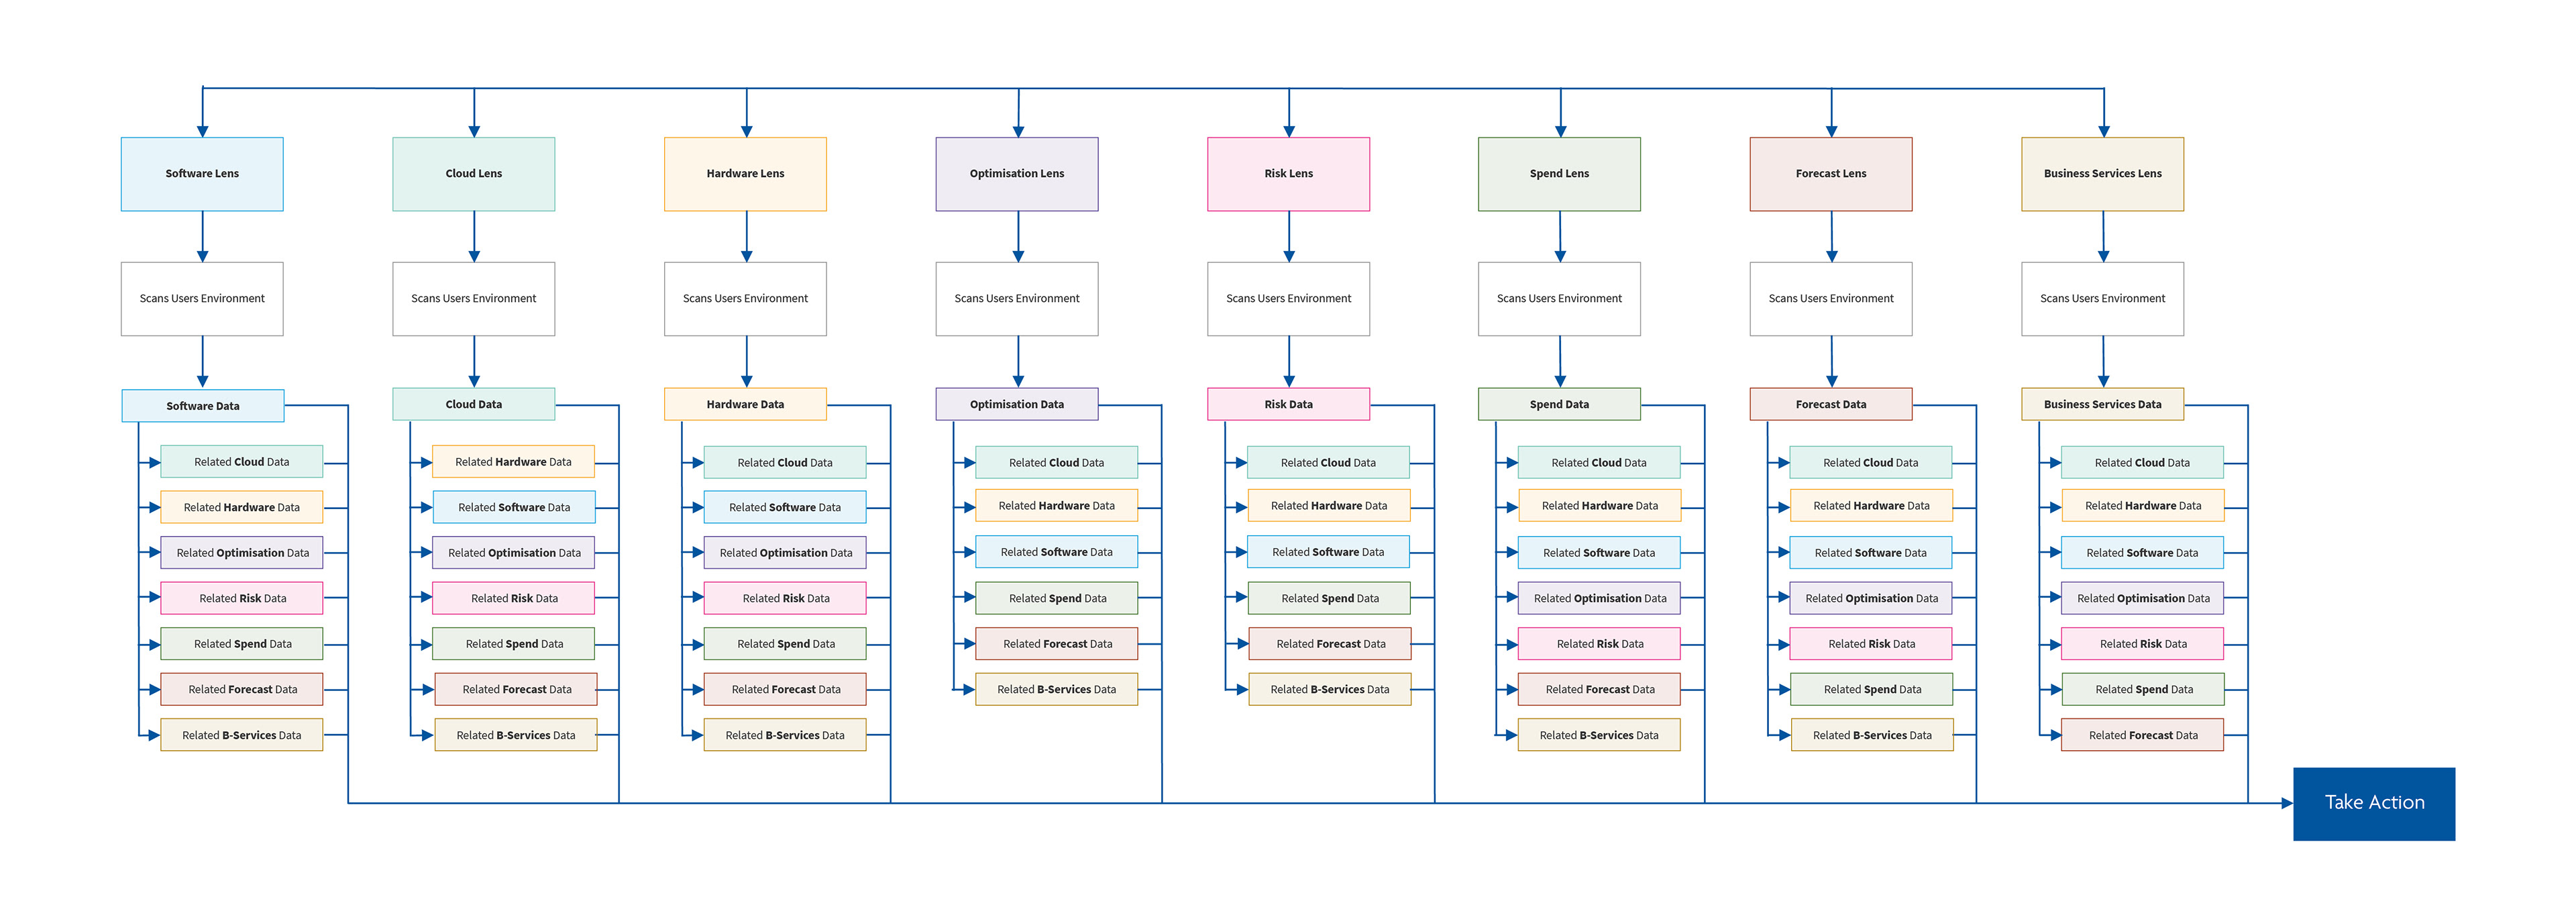
If a user wanted to look at their IT environment from a Software (LENS) perspective and filter it by a vendor, such as Microsoft they would see:
MICROSOFT SOFTWARE ONLY + any of the following connected data points:
• Cloud
• Hardware
• Optimisation
• Risk
• Spend
• Forecasts
• Business Services
Pivoting the view by data LENS will quickly reveal different patterns and insights.
To validate this further, I conducted more research to understand how users are getting insights from the data today...
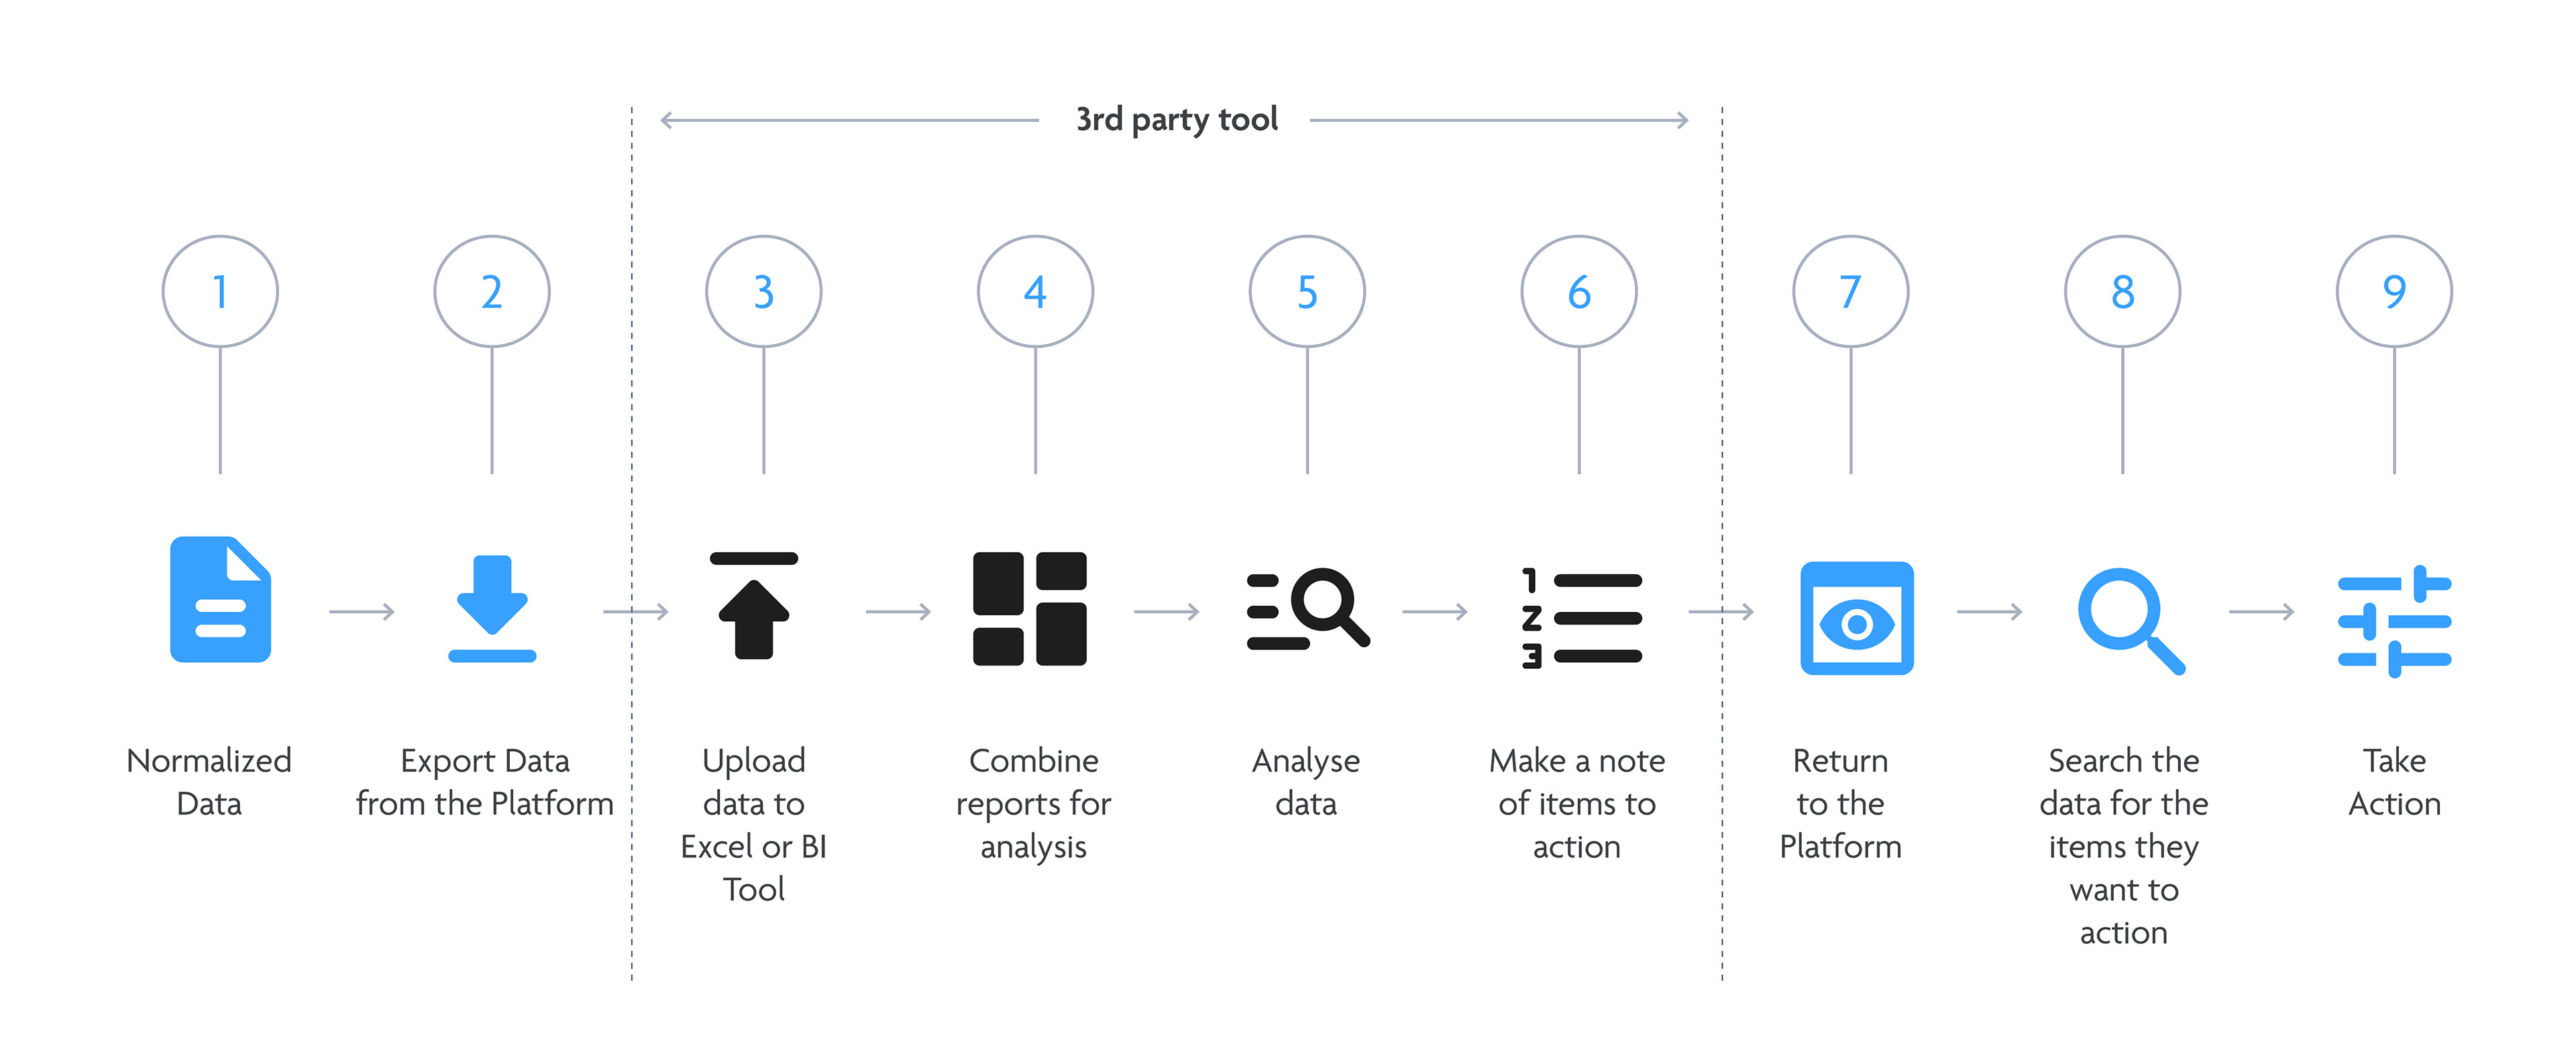
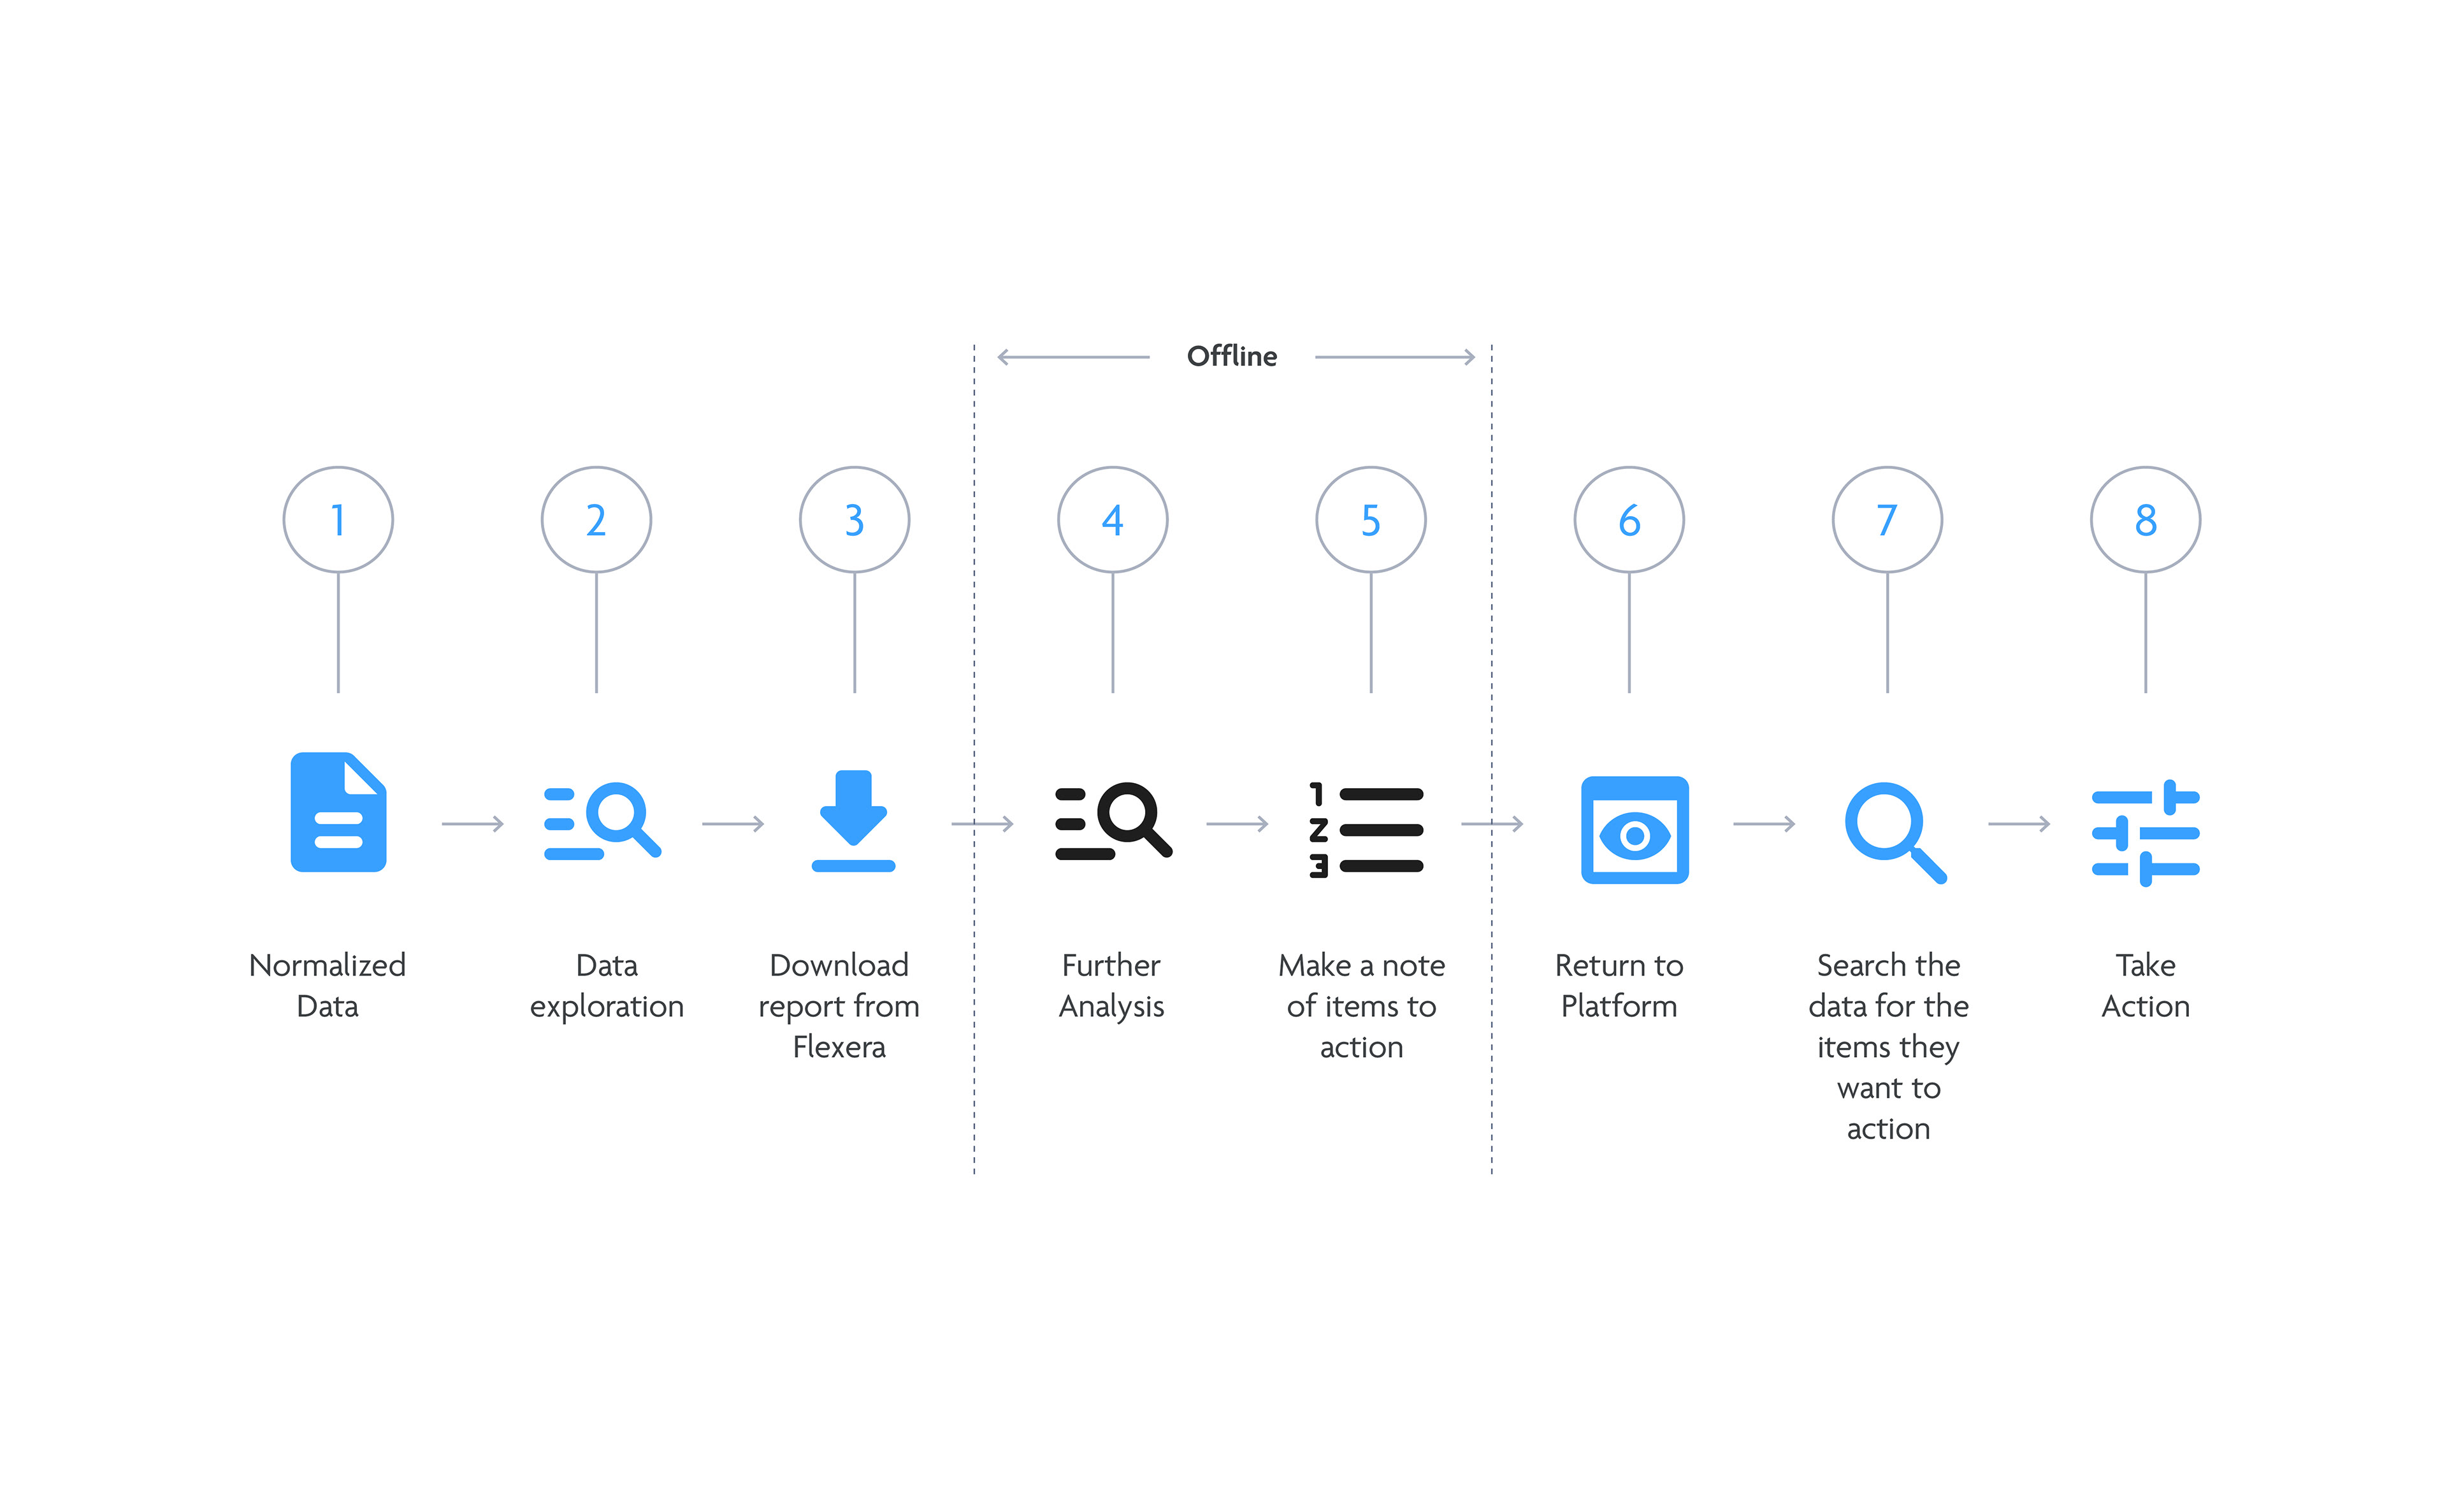
I interviewed customers to understand how they used the system today and how they used the data they garnered from it. Based on those insights I was able to create a user flow diagram that illustrates the steps and actions that users take when answering a business use case.
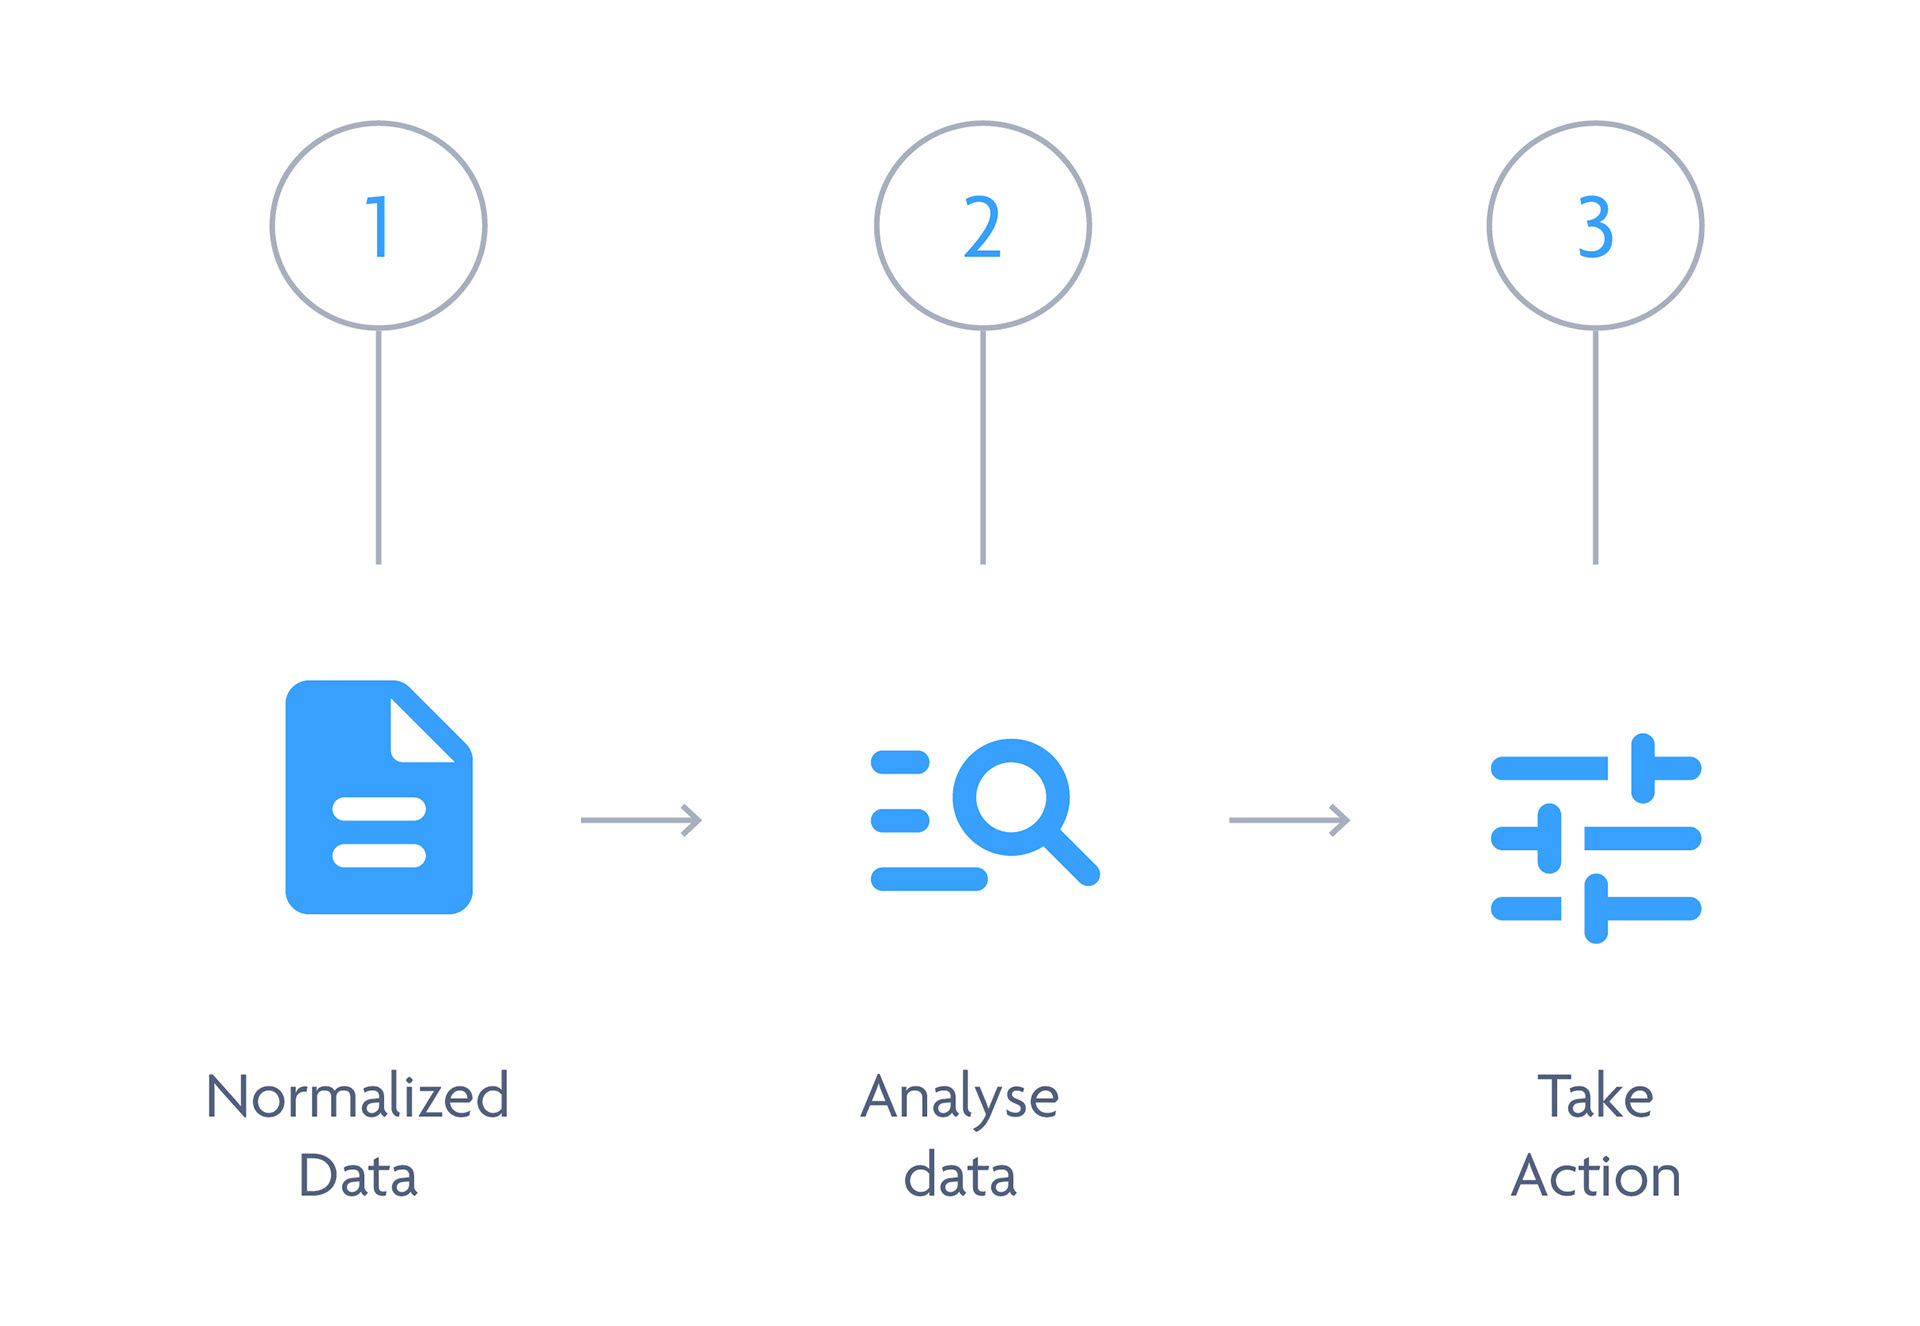
Current user workflow
What I learned:
The current workflow takes 9 steps and requires the user to exit the platform for data analysis and then return to the platform to take action, such as removing applications, adjusting license allocation, and applying software patches.
This presented several problems
1. The workflow below must be repeated on a regular basis, in order to gain accurate insights.
2. The user needs multiple tools to perform analysis and take action.
3. As the data is exported for analysis, there is no real-time visibility of what is happening in a user's IT infrastructure which leaves them open to risks.
4. It is a very manual and labour intensive process.
New proposed workflow
By enabling users to combine and visualise data within the platform, the effort needed to obtain insights will be reduced by 66.67% . The platform will also enhance the confidence and trust users have in the insights they obtain as the data will be refreshed daily.
Estimated 66% reduction in effort

Prototype 2
Query lens builder that enables users to quickly surface high level insights from preconfigured dashboards that enable them to drill in on their data and take action.

User testing
Value = 3.4 out of 5
Ease of use = 3 out of 5
Positive:
1. Users liked the ability to drill in and see related insights
2. Users liked the ability to filter the data views
Negative:
1. Data views were static and restrictive
2. Not all insights are relevant to each user's use case
3. Data was siloed - Users would prefer data to be in the same data table
4. Users could only analyse one data group at a time
5. Data still needed to be exported and collated offline
What I learned:
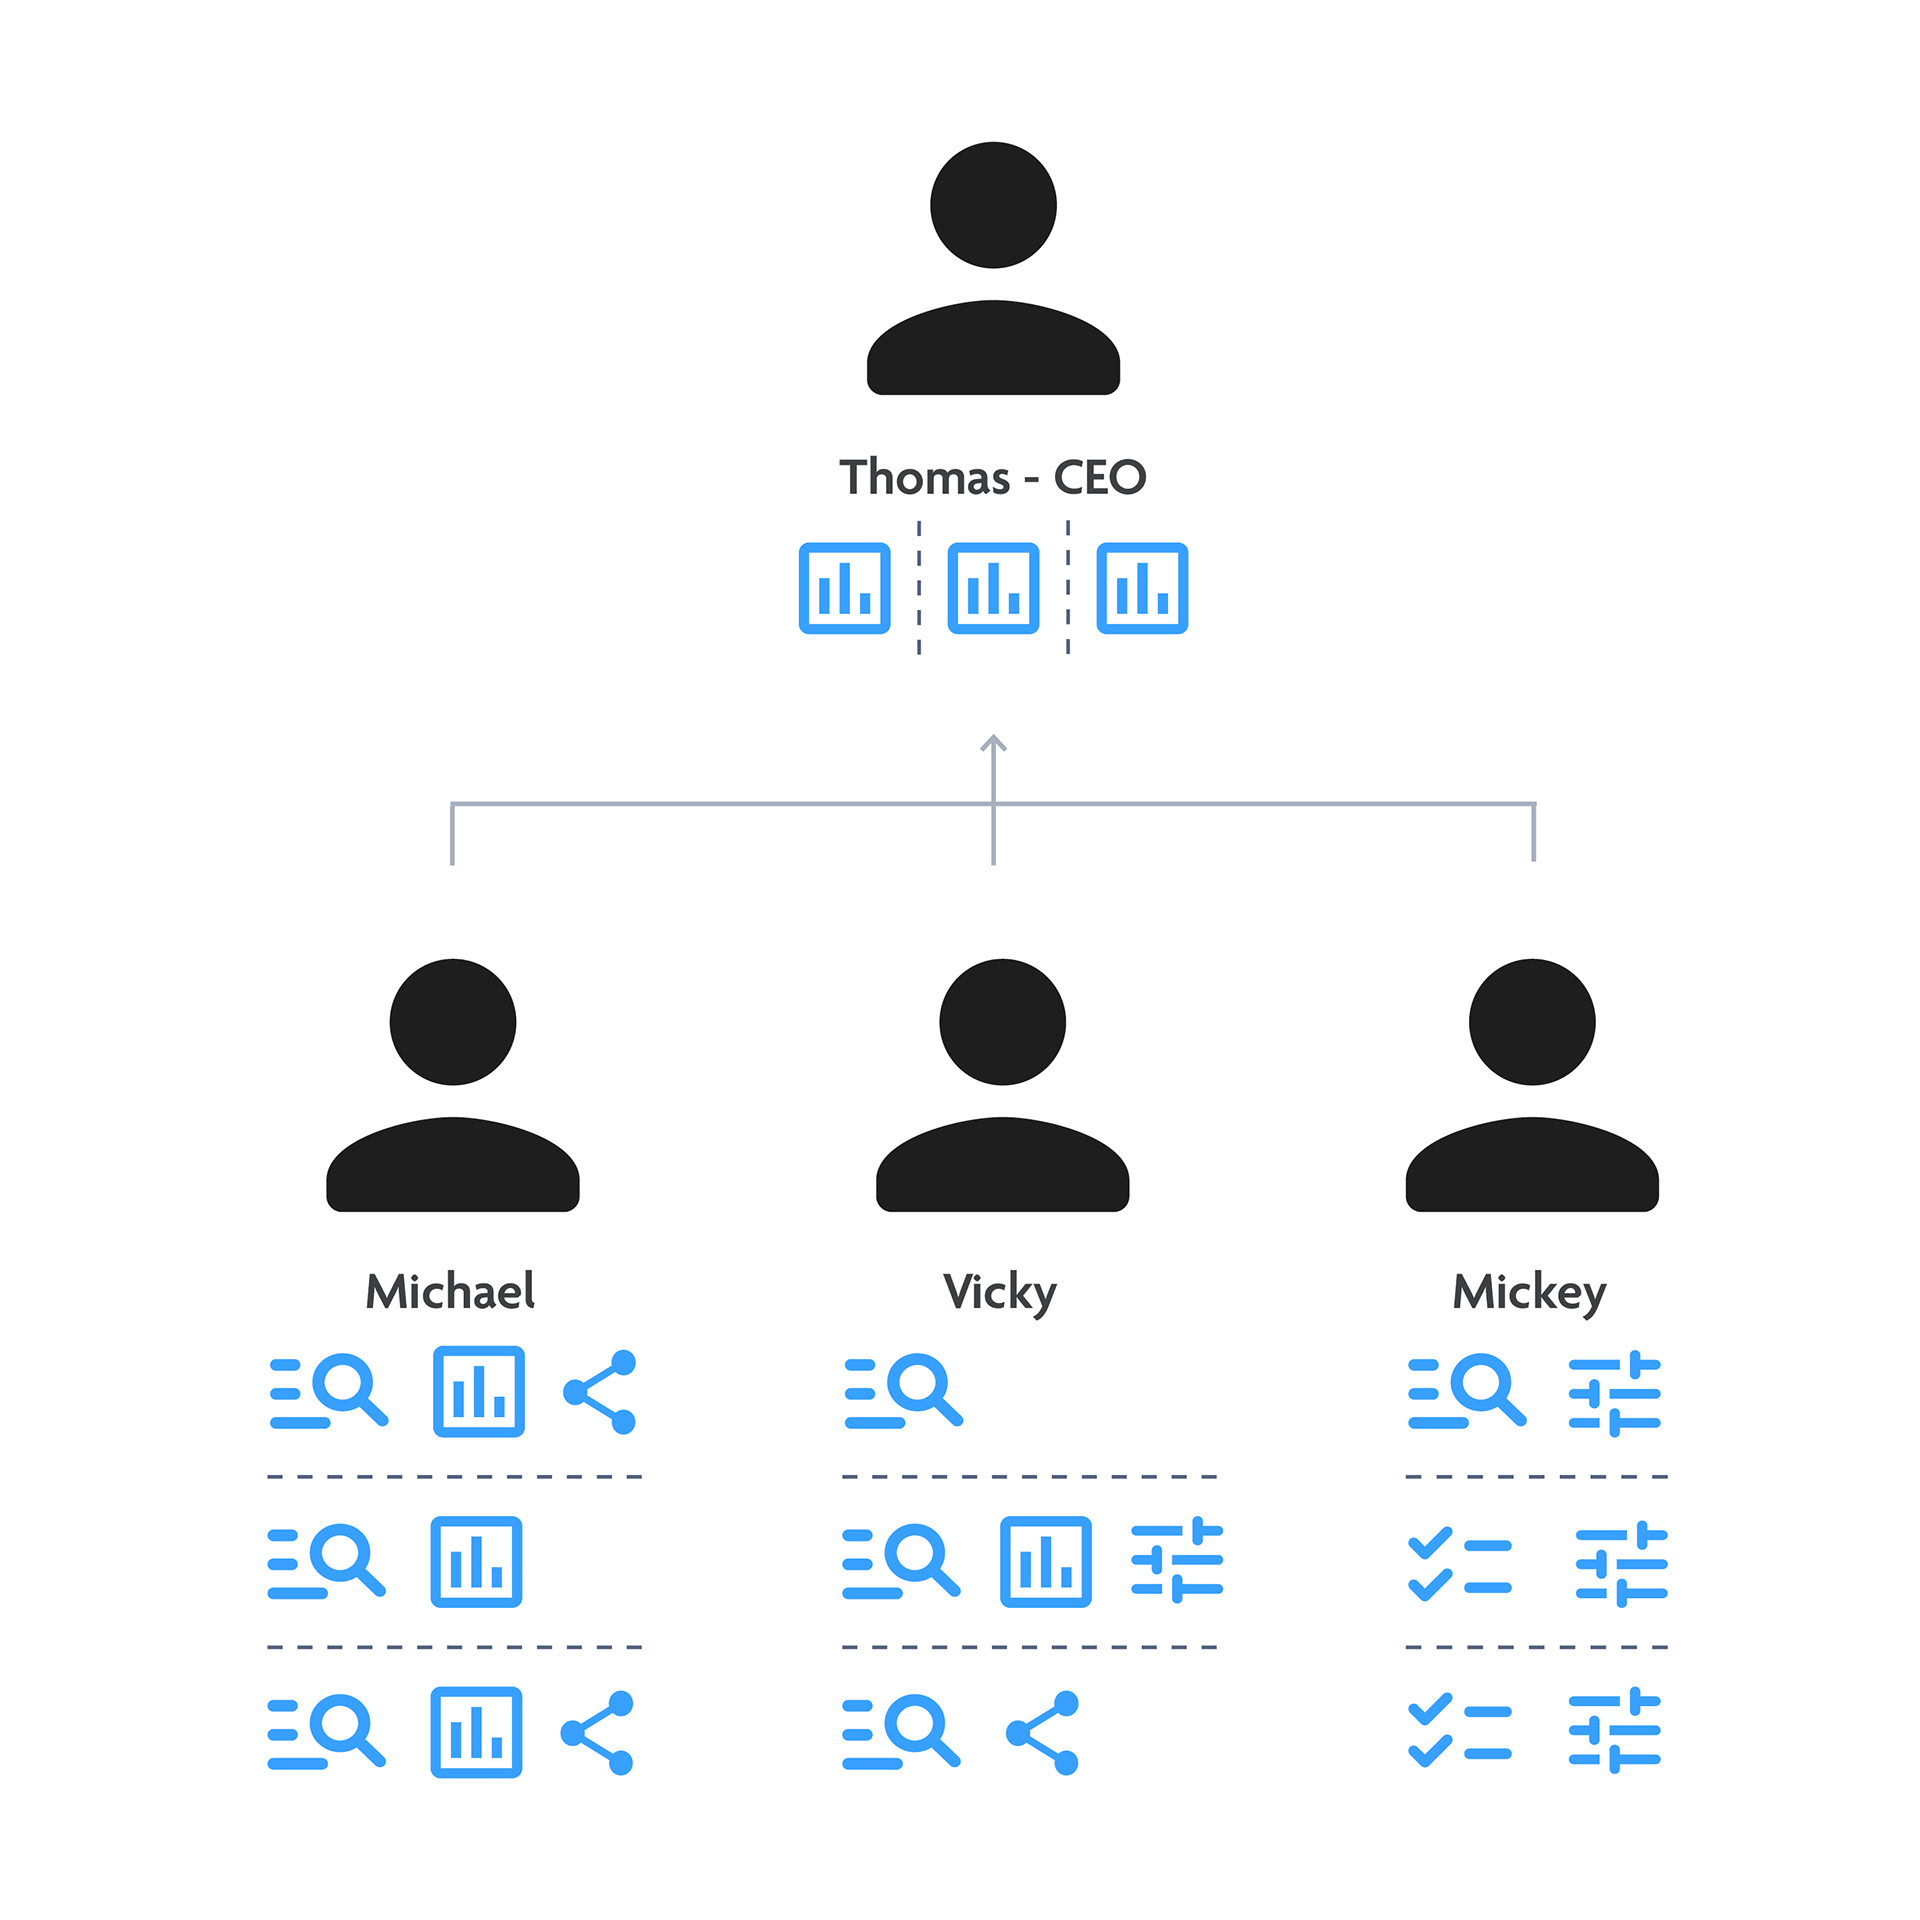
1. Users analyse multiple use cases at the same time and share these across the business.
2. CEOs want high level insights into the performance and progress of the company. They may not want or need to go through every report or dashboard in detail, but they still require a reliable and concise overview of the key metrics and trends.
3. Each department has its own use cases that depend on its particular needs and challenges. Therefore, they may need different data to reach their objectives.
4. Data still needed to be downloaded and collated offline.
6. The current concept only managed to remove one step in the workflow, only achieving a 11% reduction in effort.
Only a 11% reduction in effort achieved
Ideation and next steps
Design goals
1. Enable users to mix and customise data sets to meet the needs of their use cases
2. Enable users to create custom reports/insights/dashboards
3. Enable users to be able to drill down on custom insights
4. Enable users to collaborate with other stakeholders
5. Enable users to take action based on the live insights
— Concept 2 —
Workspaces
There are 2 parts to the workspaces concept.
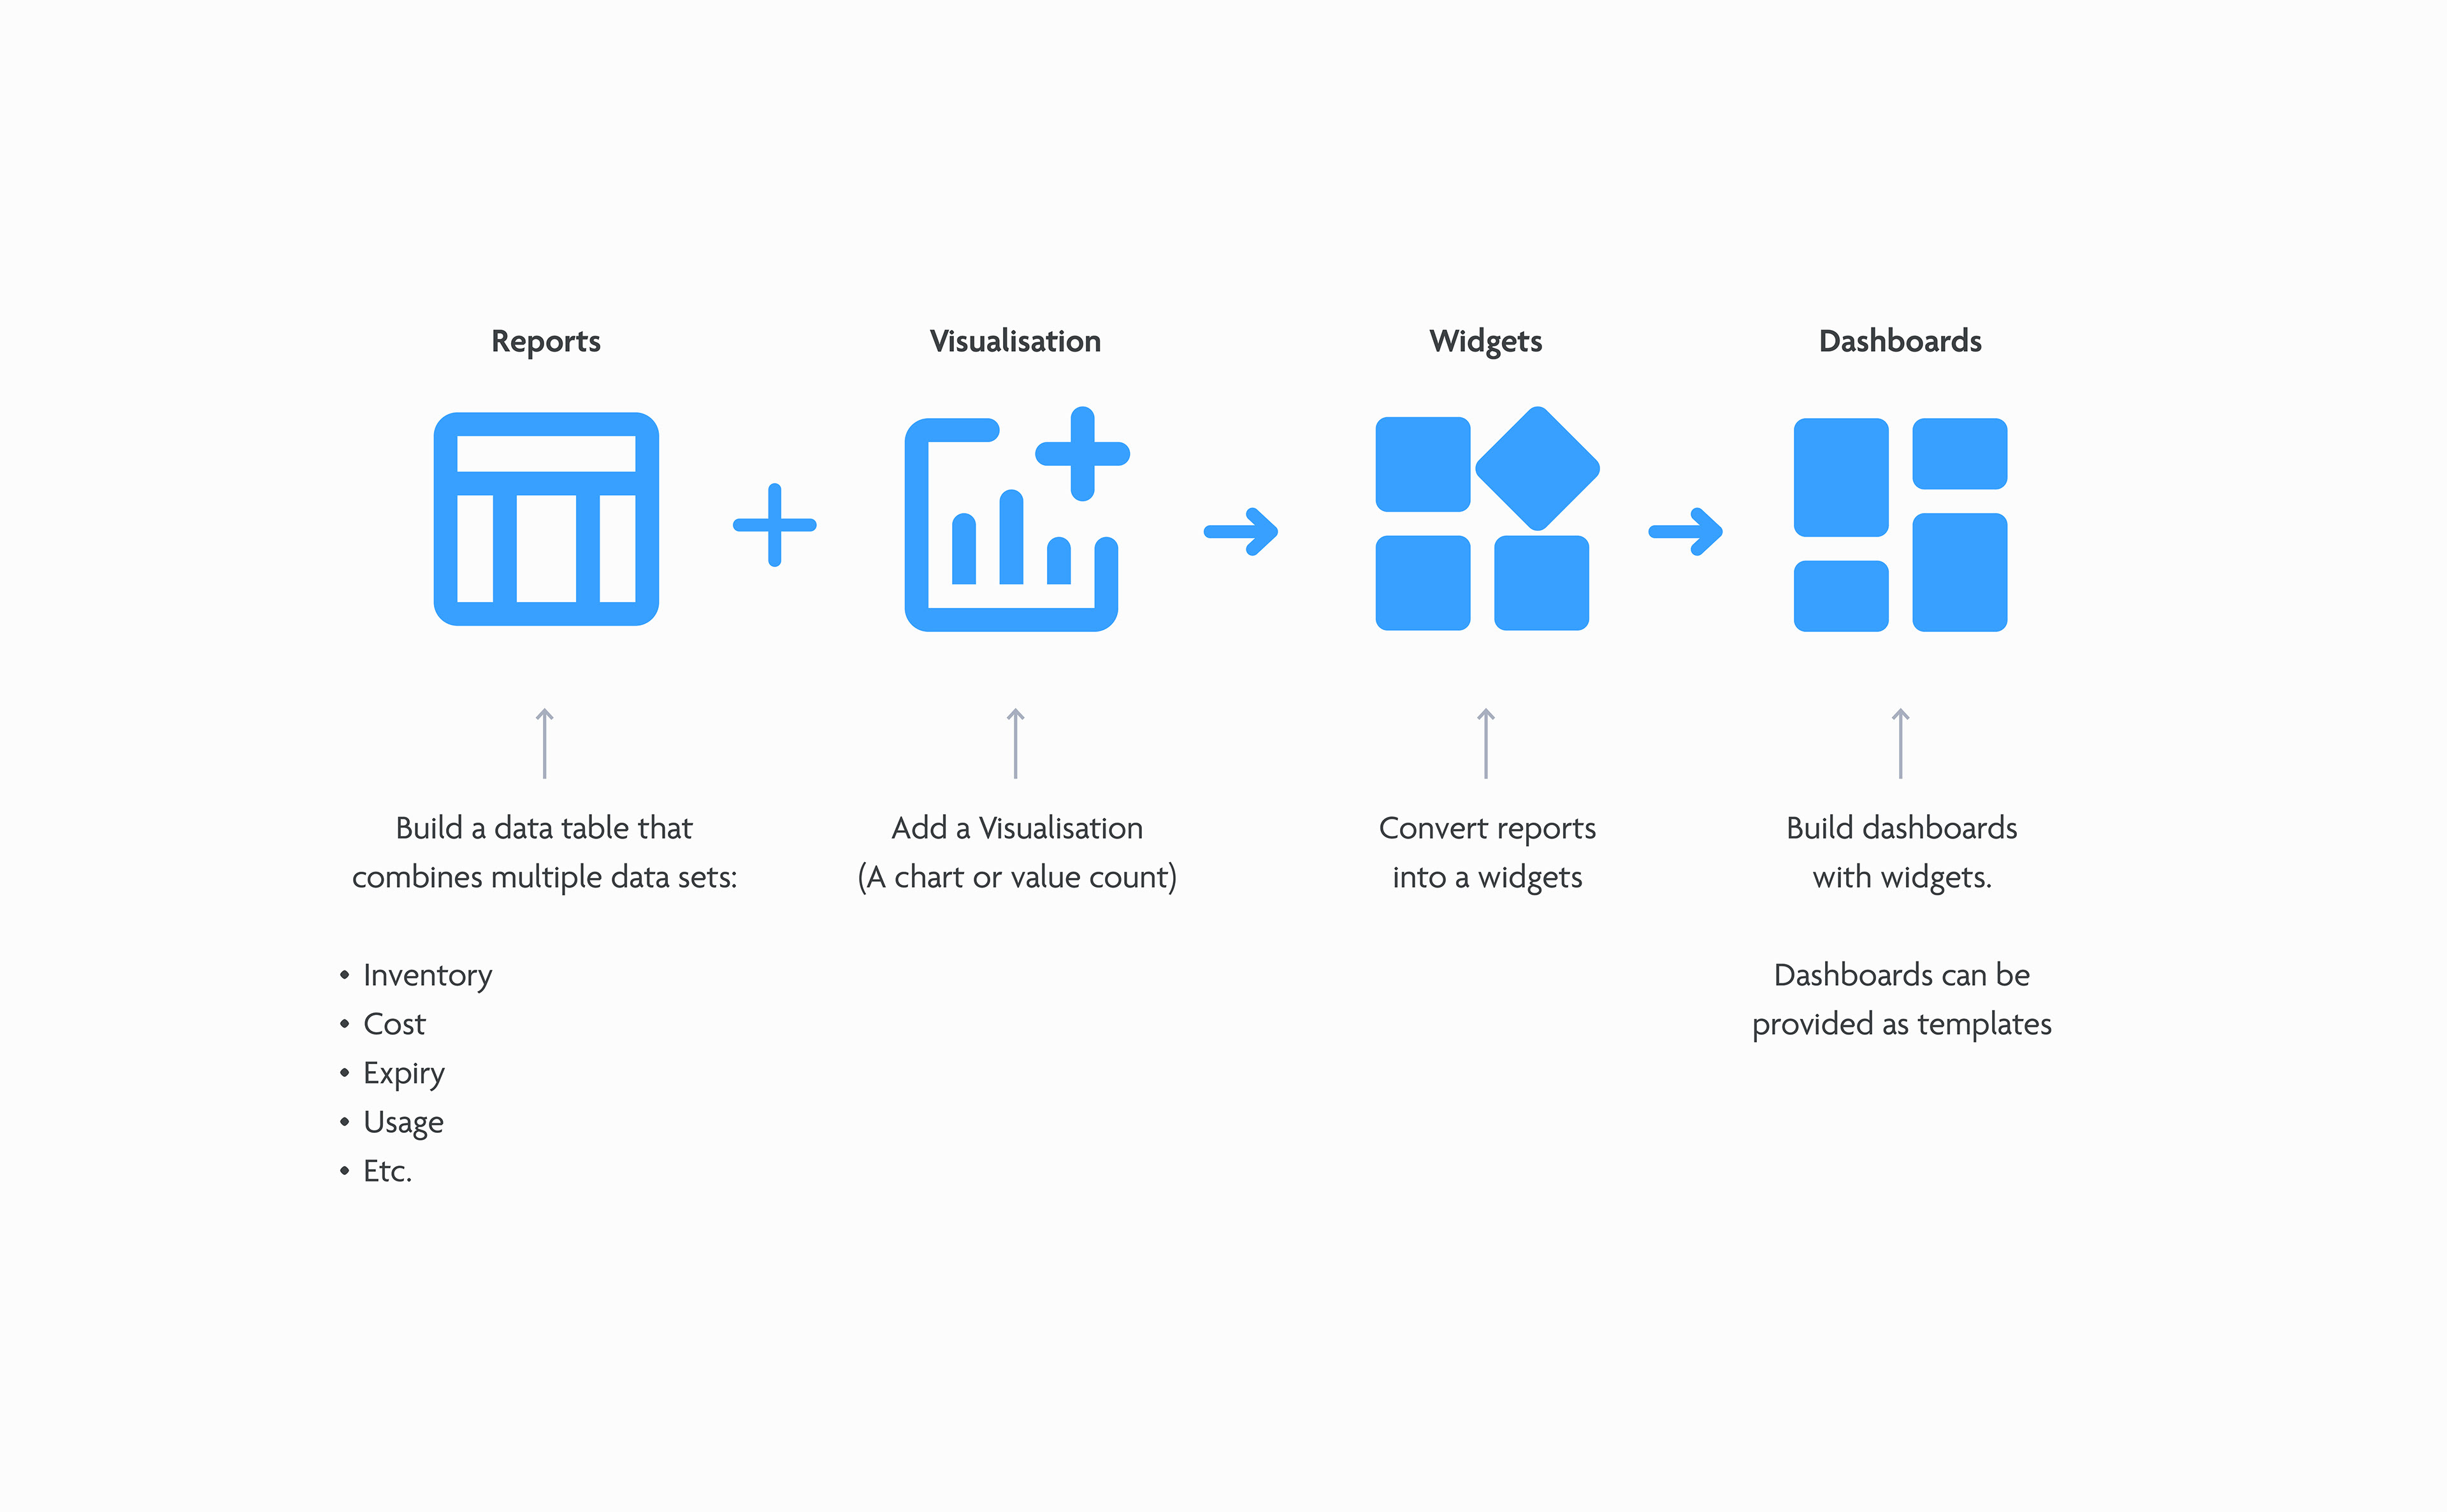
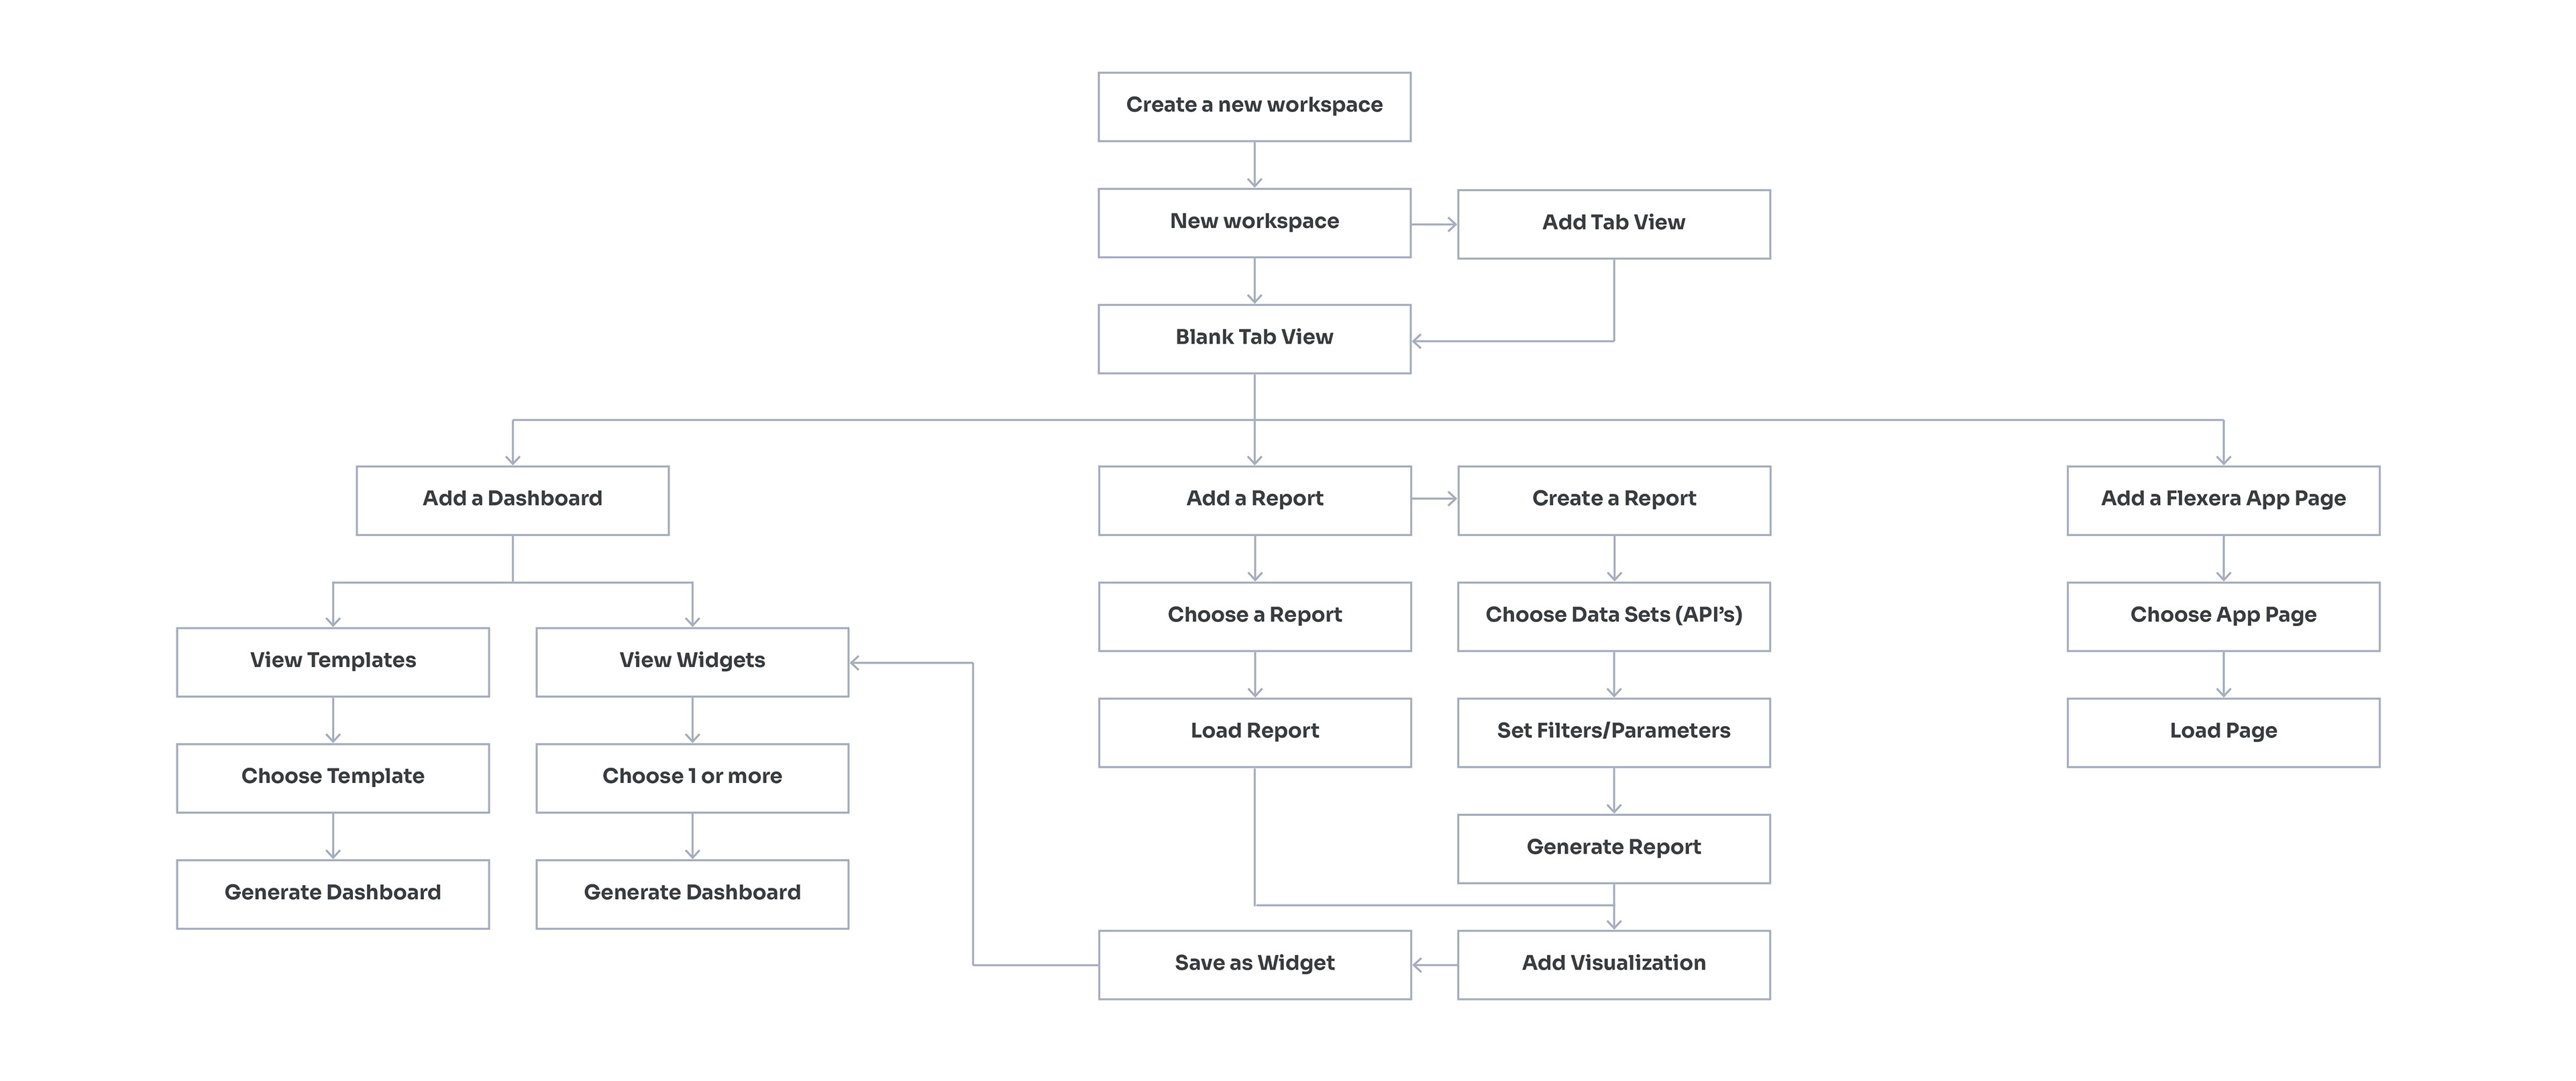
Part 1: Report builder
The new report builder concept allows users to design their own data reports according to their business needs. They can choose data sources, apply filters, and select how to display the data with visual elements such as charts, graphs, and maps. Once a report has been designed, they can save it as a widget that can be reused and embedded in different dashboards.
User flow
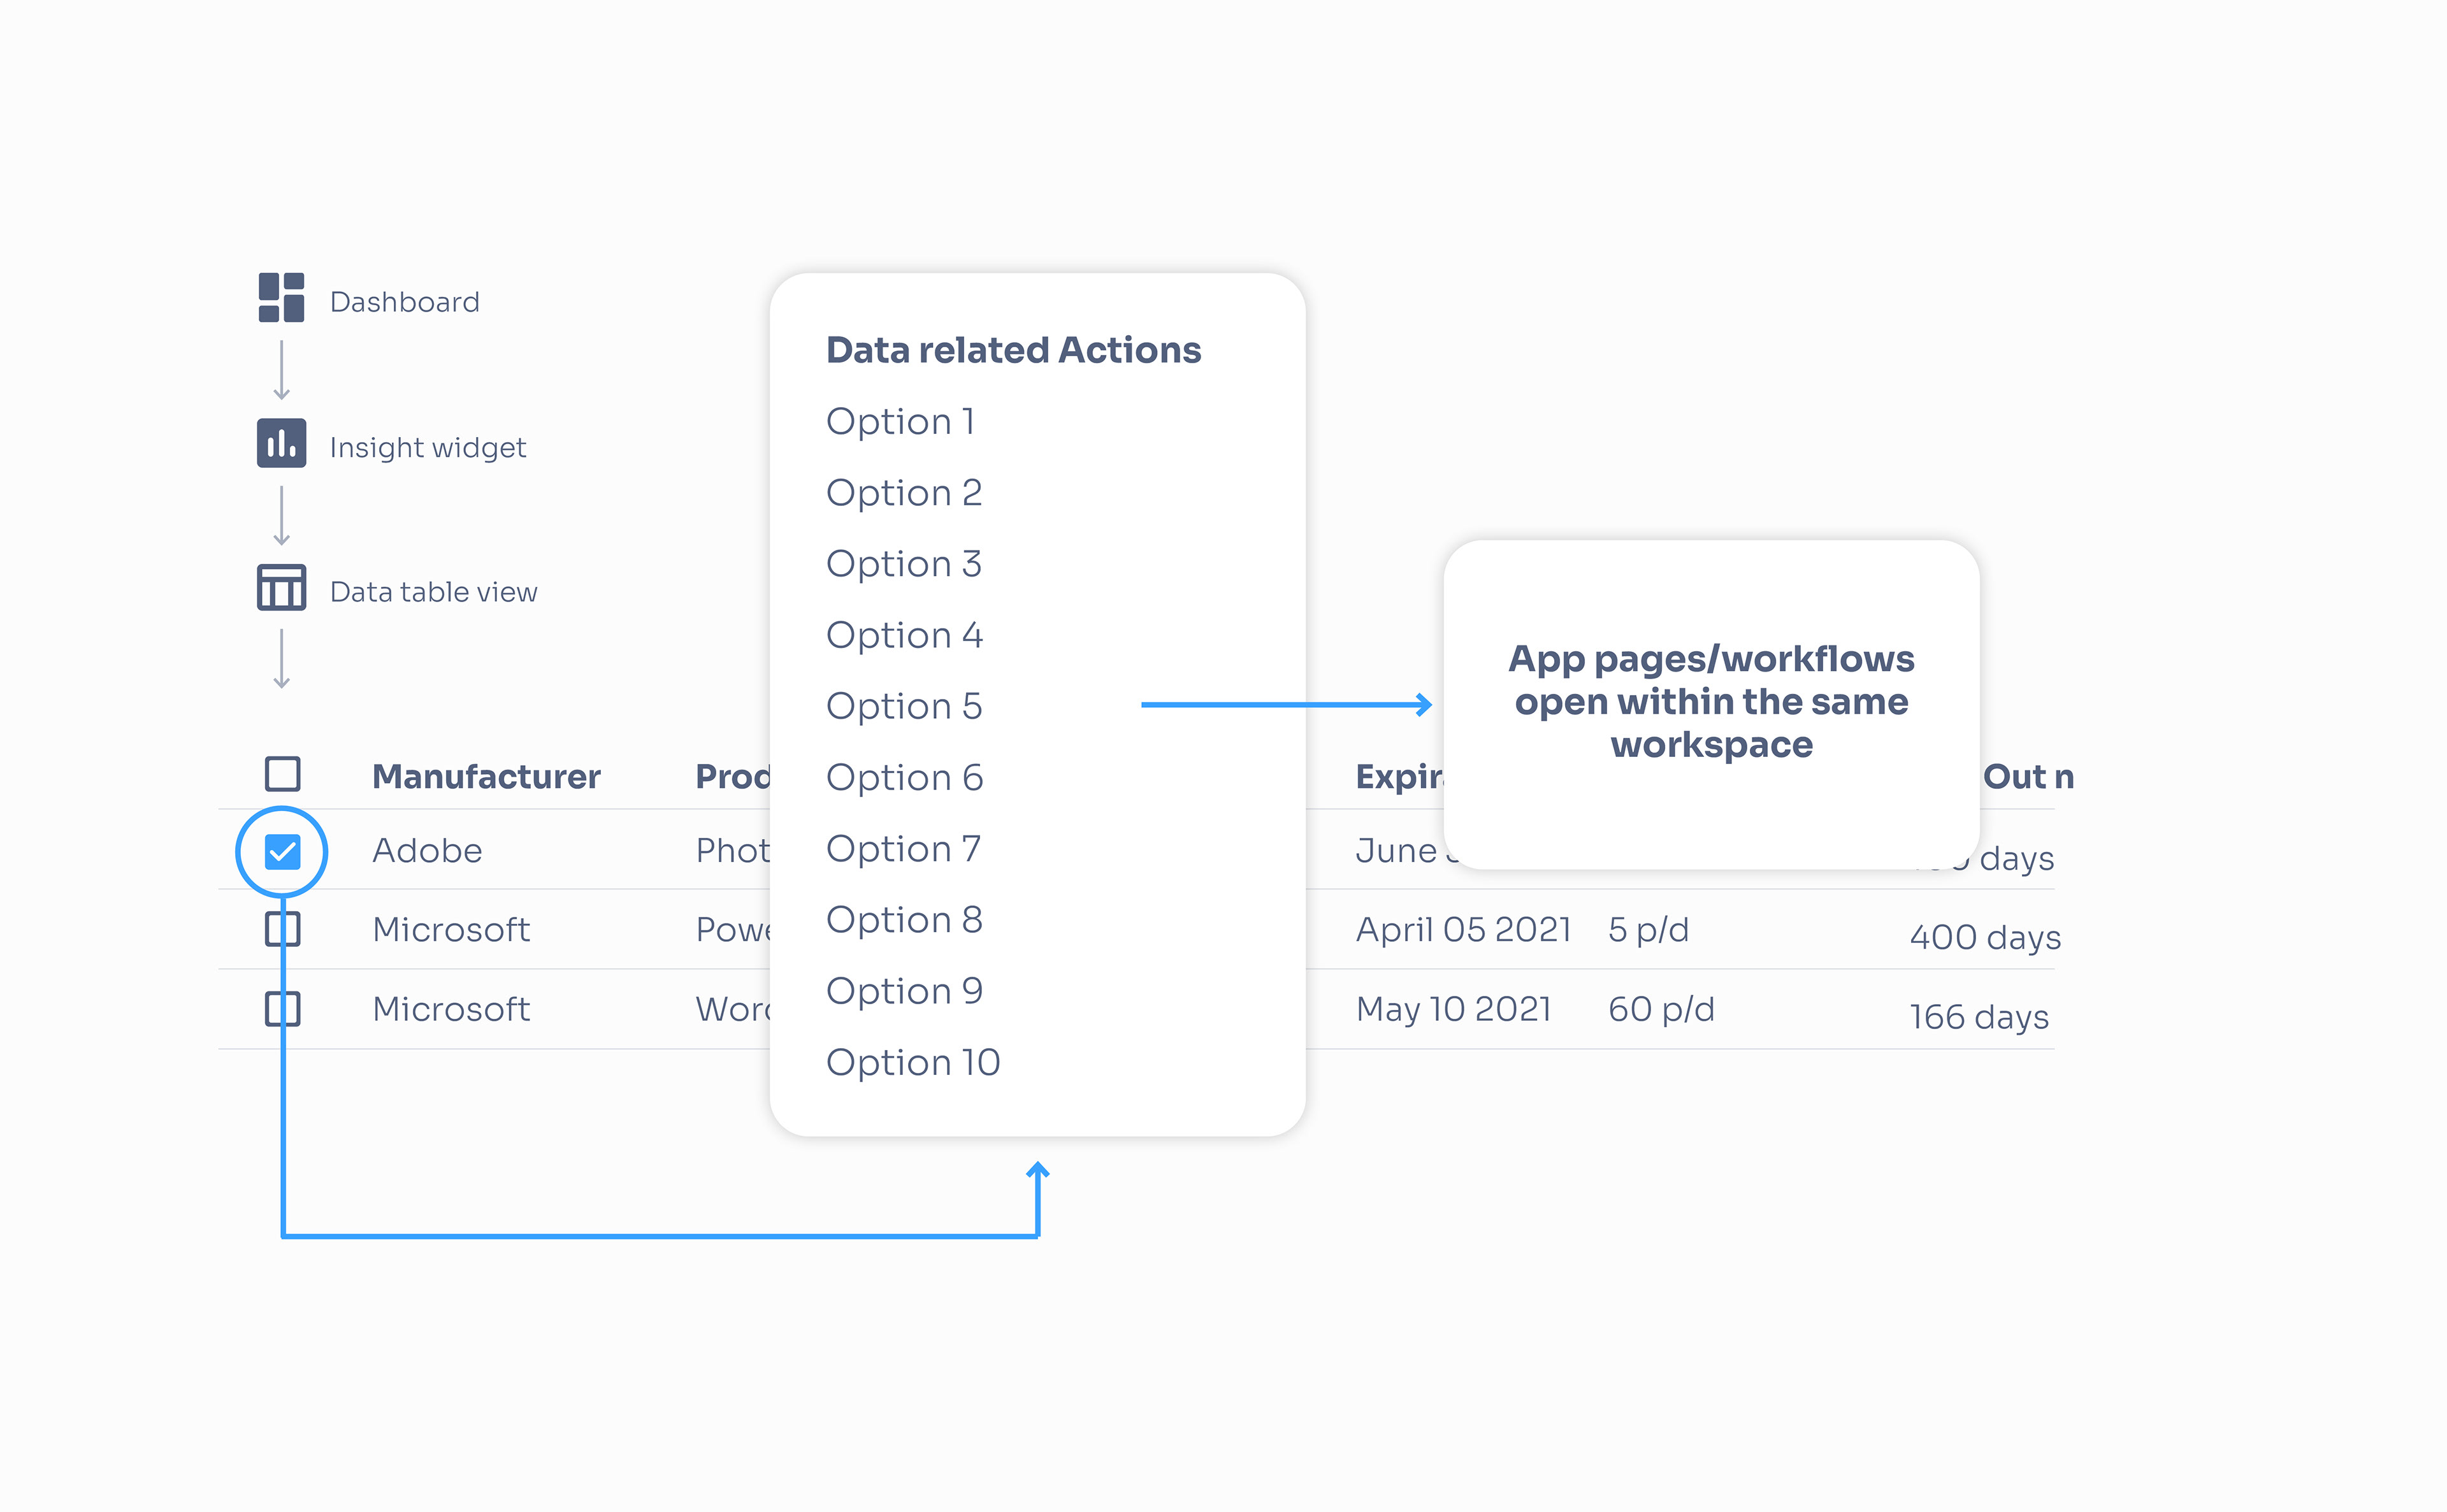
The dashboard gives users a clear picture of their data, showing important metrics and trends. Users can then dig deeper into the data by clicking on any dashboard element, which will show the original data and let them use the platform's management features. These features help users to easily manage and reduce risk in their IT environments.
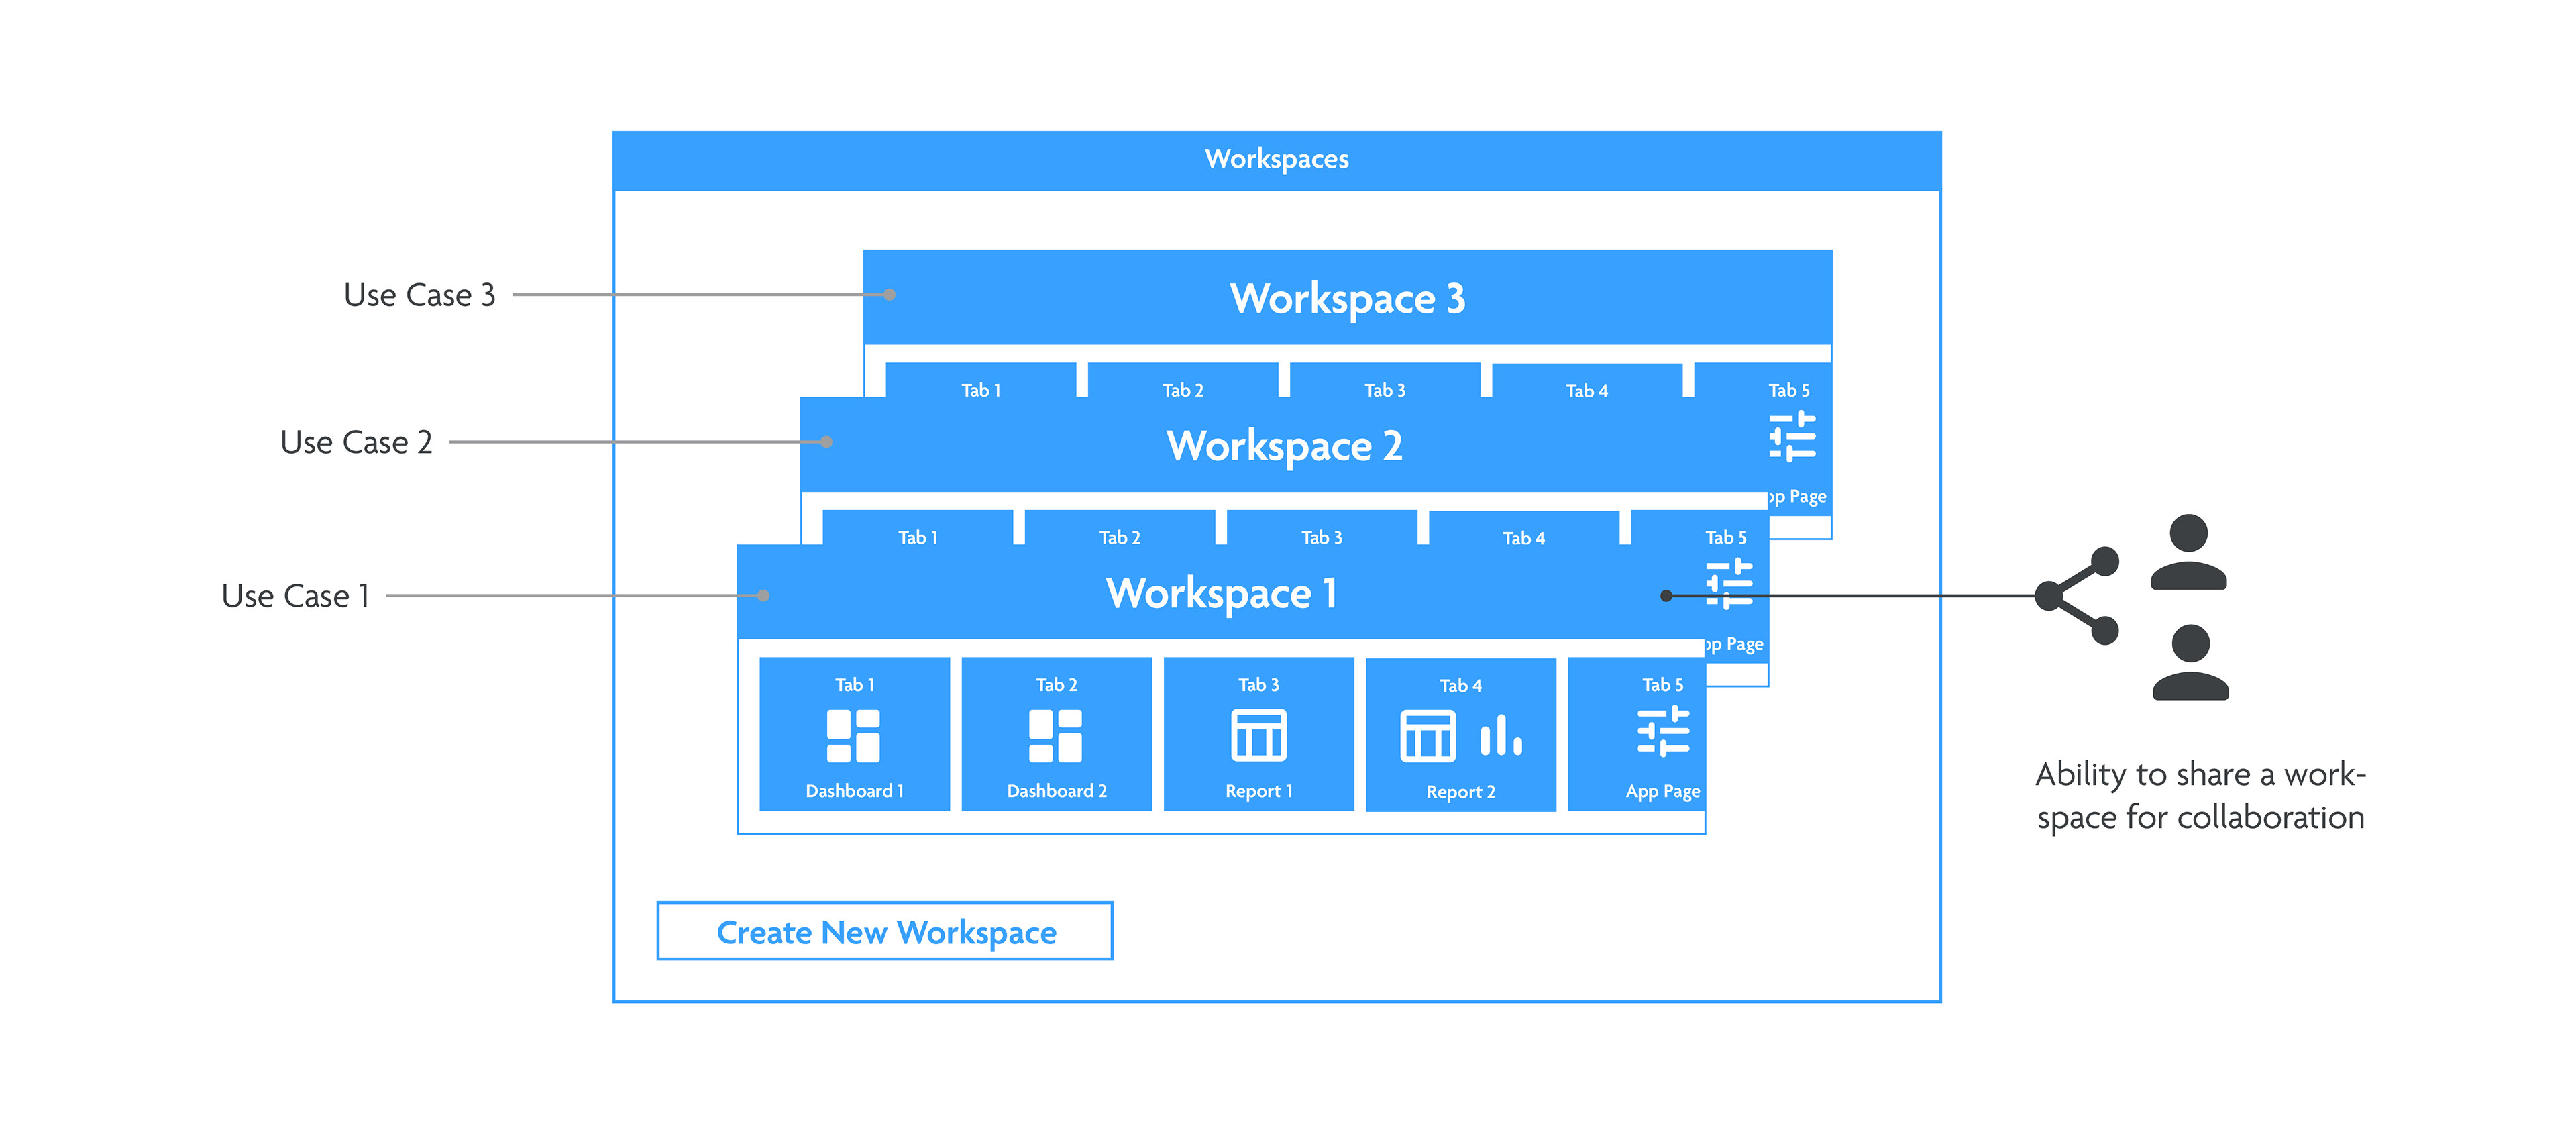
Part 2: Collaboration
One of the tasks of a data analyst is to collate reports and dashboards that summarise the findings and insights from the data. They then need to share these reports and dashboards with other stakeholders, such as managers, clients, or colleagues, and collaborate with them to decide what action to take.
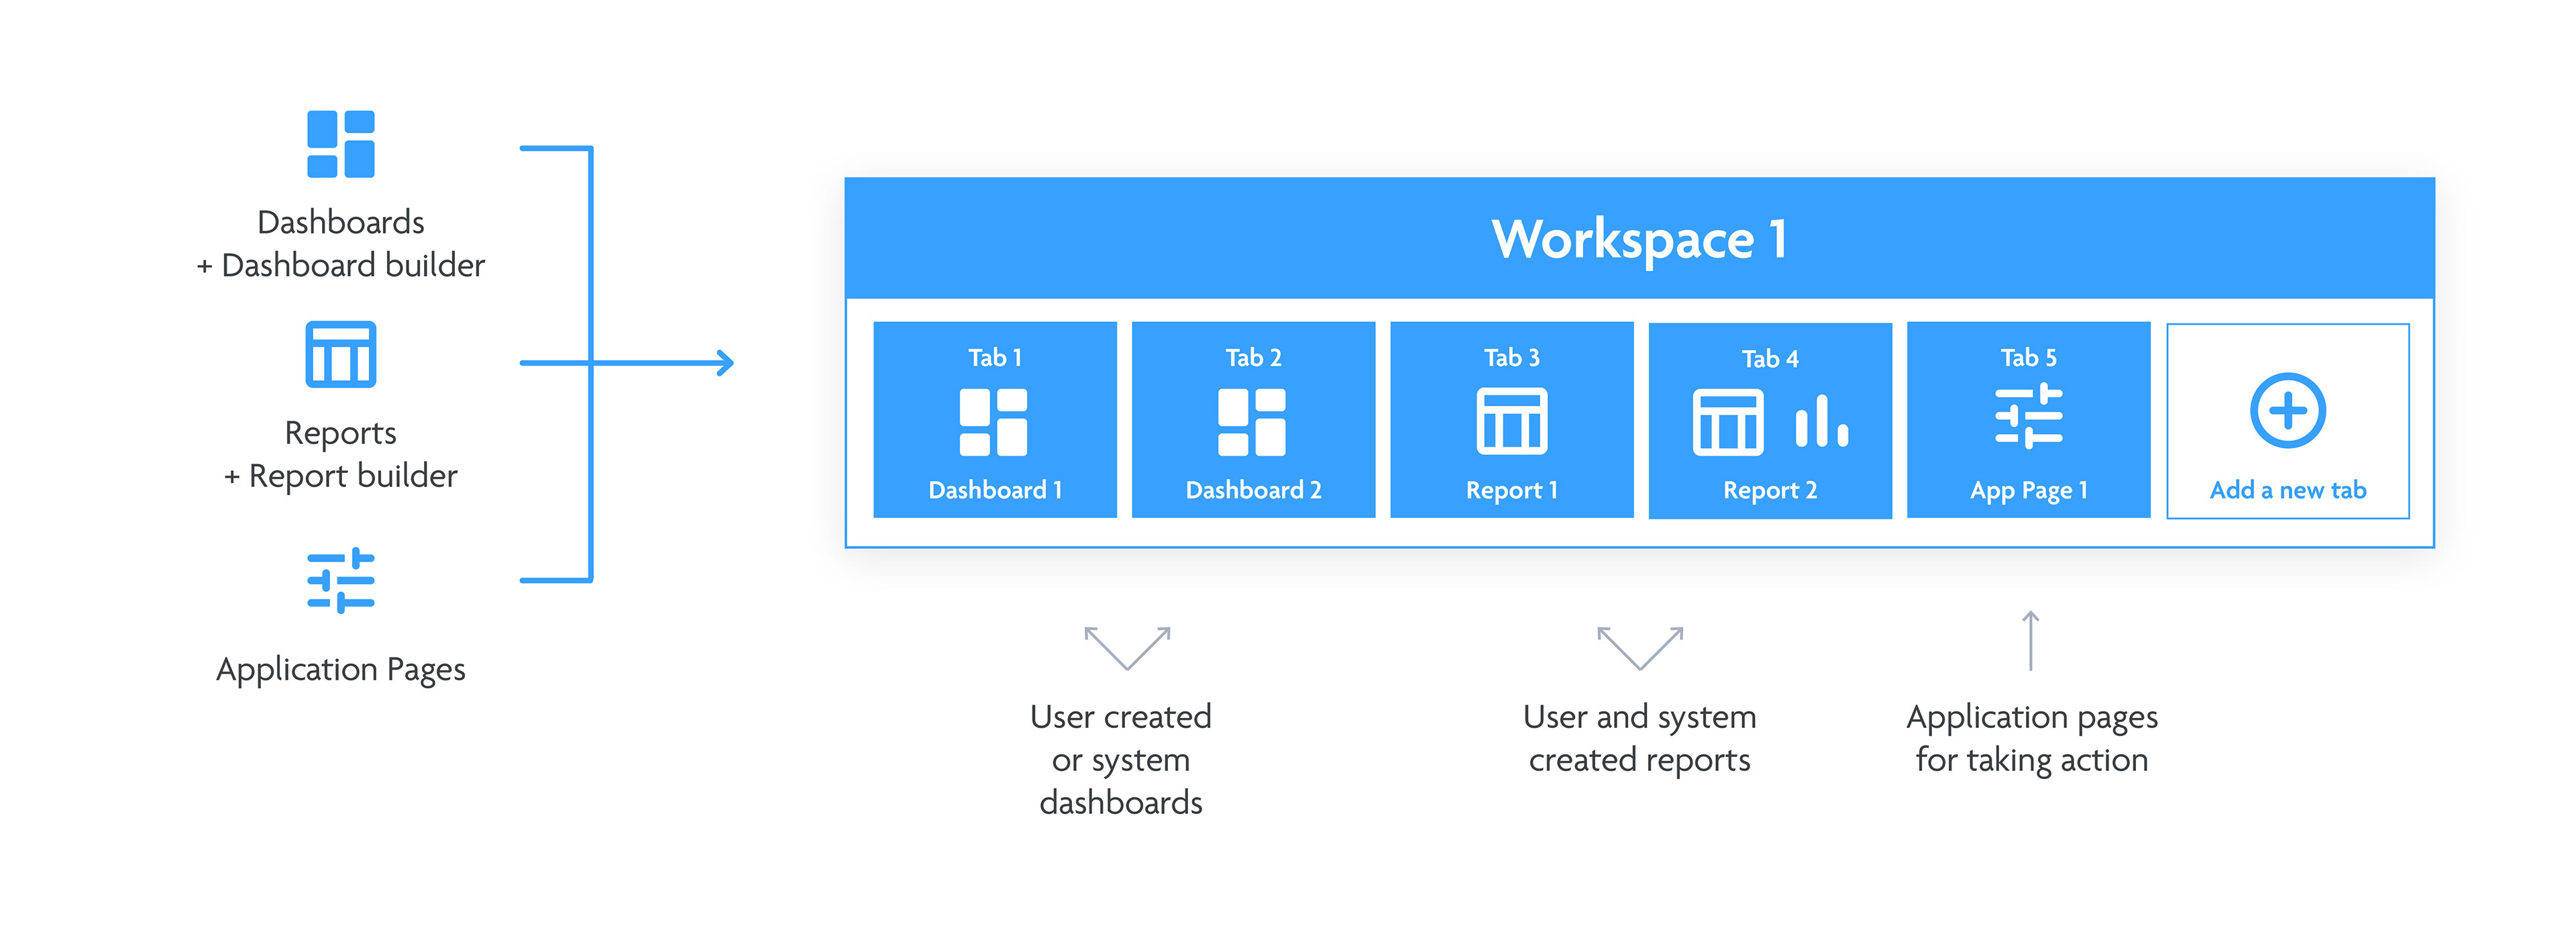
So what is a workspace?
A workspace is a digital space, much like a web browser. It is a flexible solution with browser tabs that enables the user to import multiple dashboards, reports and applications into one space, based on the users use case.
What does it solve?
1. It helps users organise, access and share their data and insights more easily and efficiently.
2. It supports collaboration and communication among different users and teams.
3. It enables integration with other web enabled tools and platforms.
It also solves the original navigation problem.
Instead of users having to switch between different applications through the main menu options, which can be time-consuming and confusing. A workspace can be saved and loaded anytime, so users can quickly access their preferred data, insights, and navigation structure instantly.
Information architecture
Early interface exploration
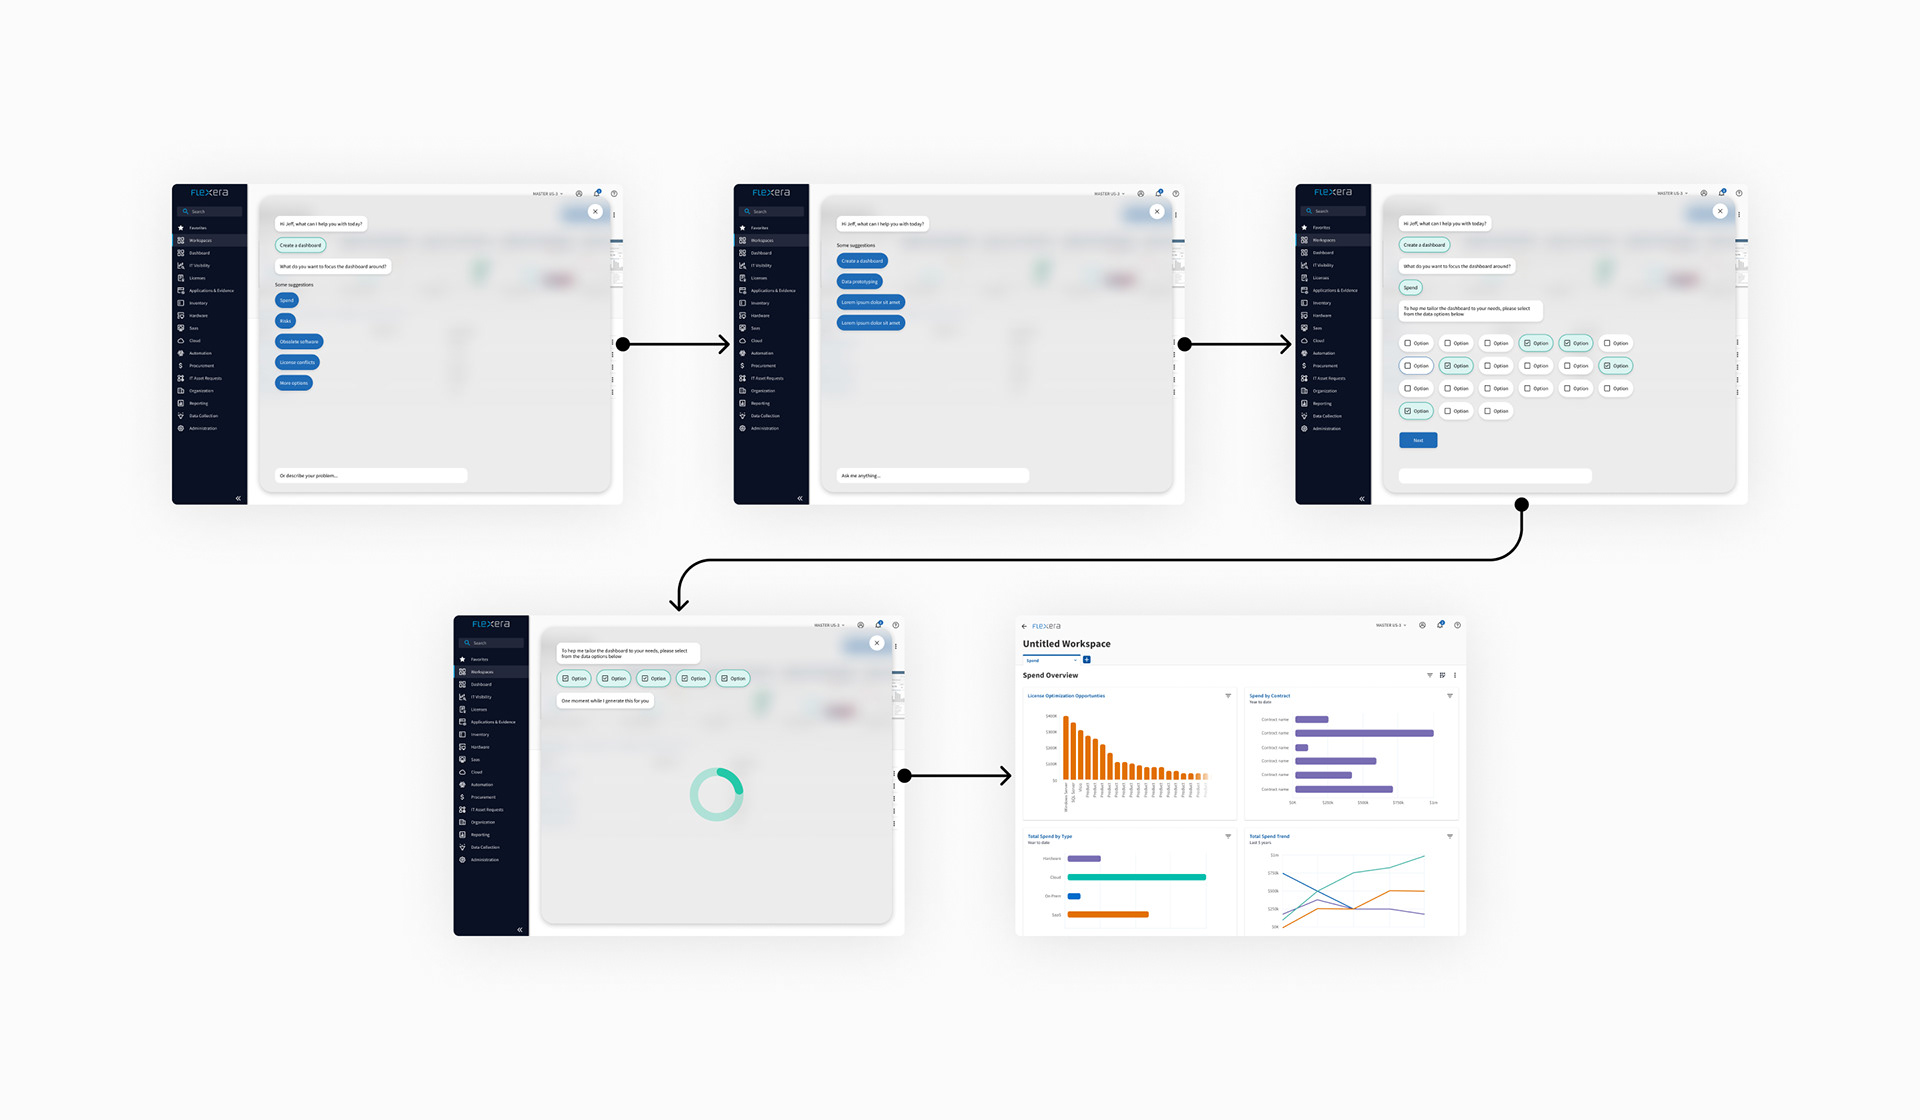
Chat bot wizard
To make it easier for users to create reports, dashboards or workspaces, I explored a chatbot wizard approach. The feedback was positive, but the users needed more clarity on how the data was organised before we could move forward with this solution
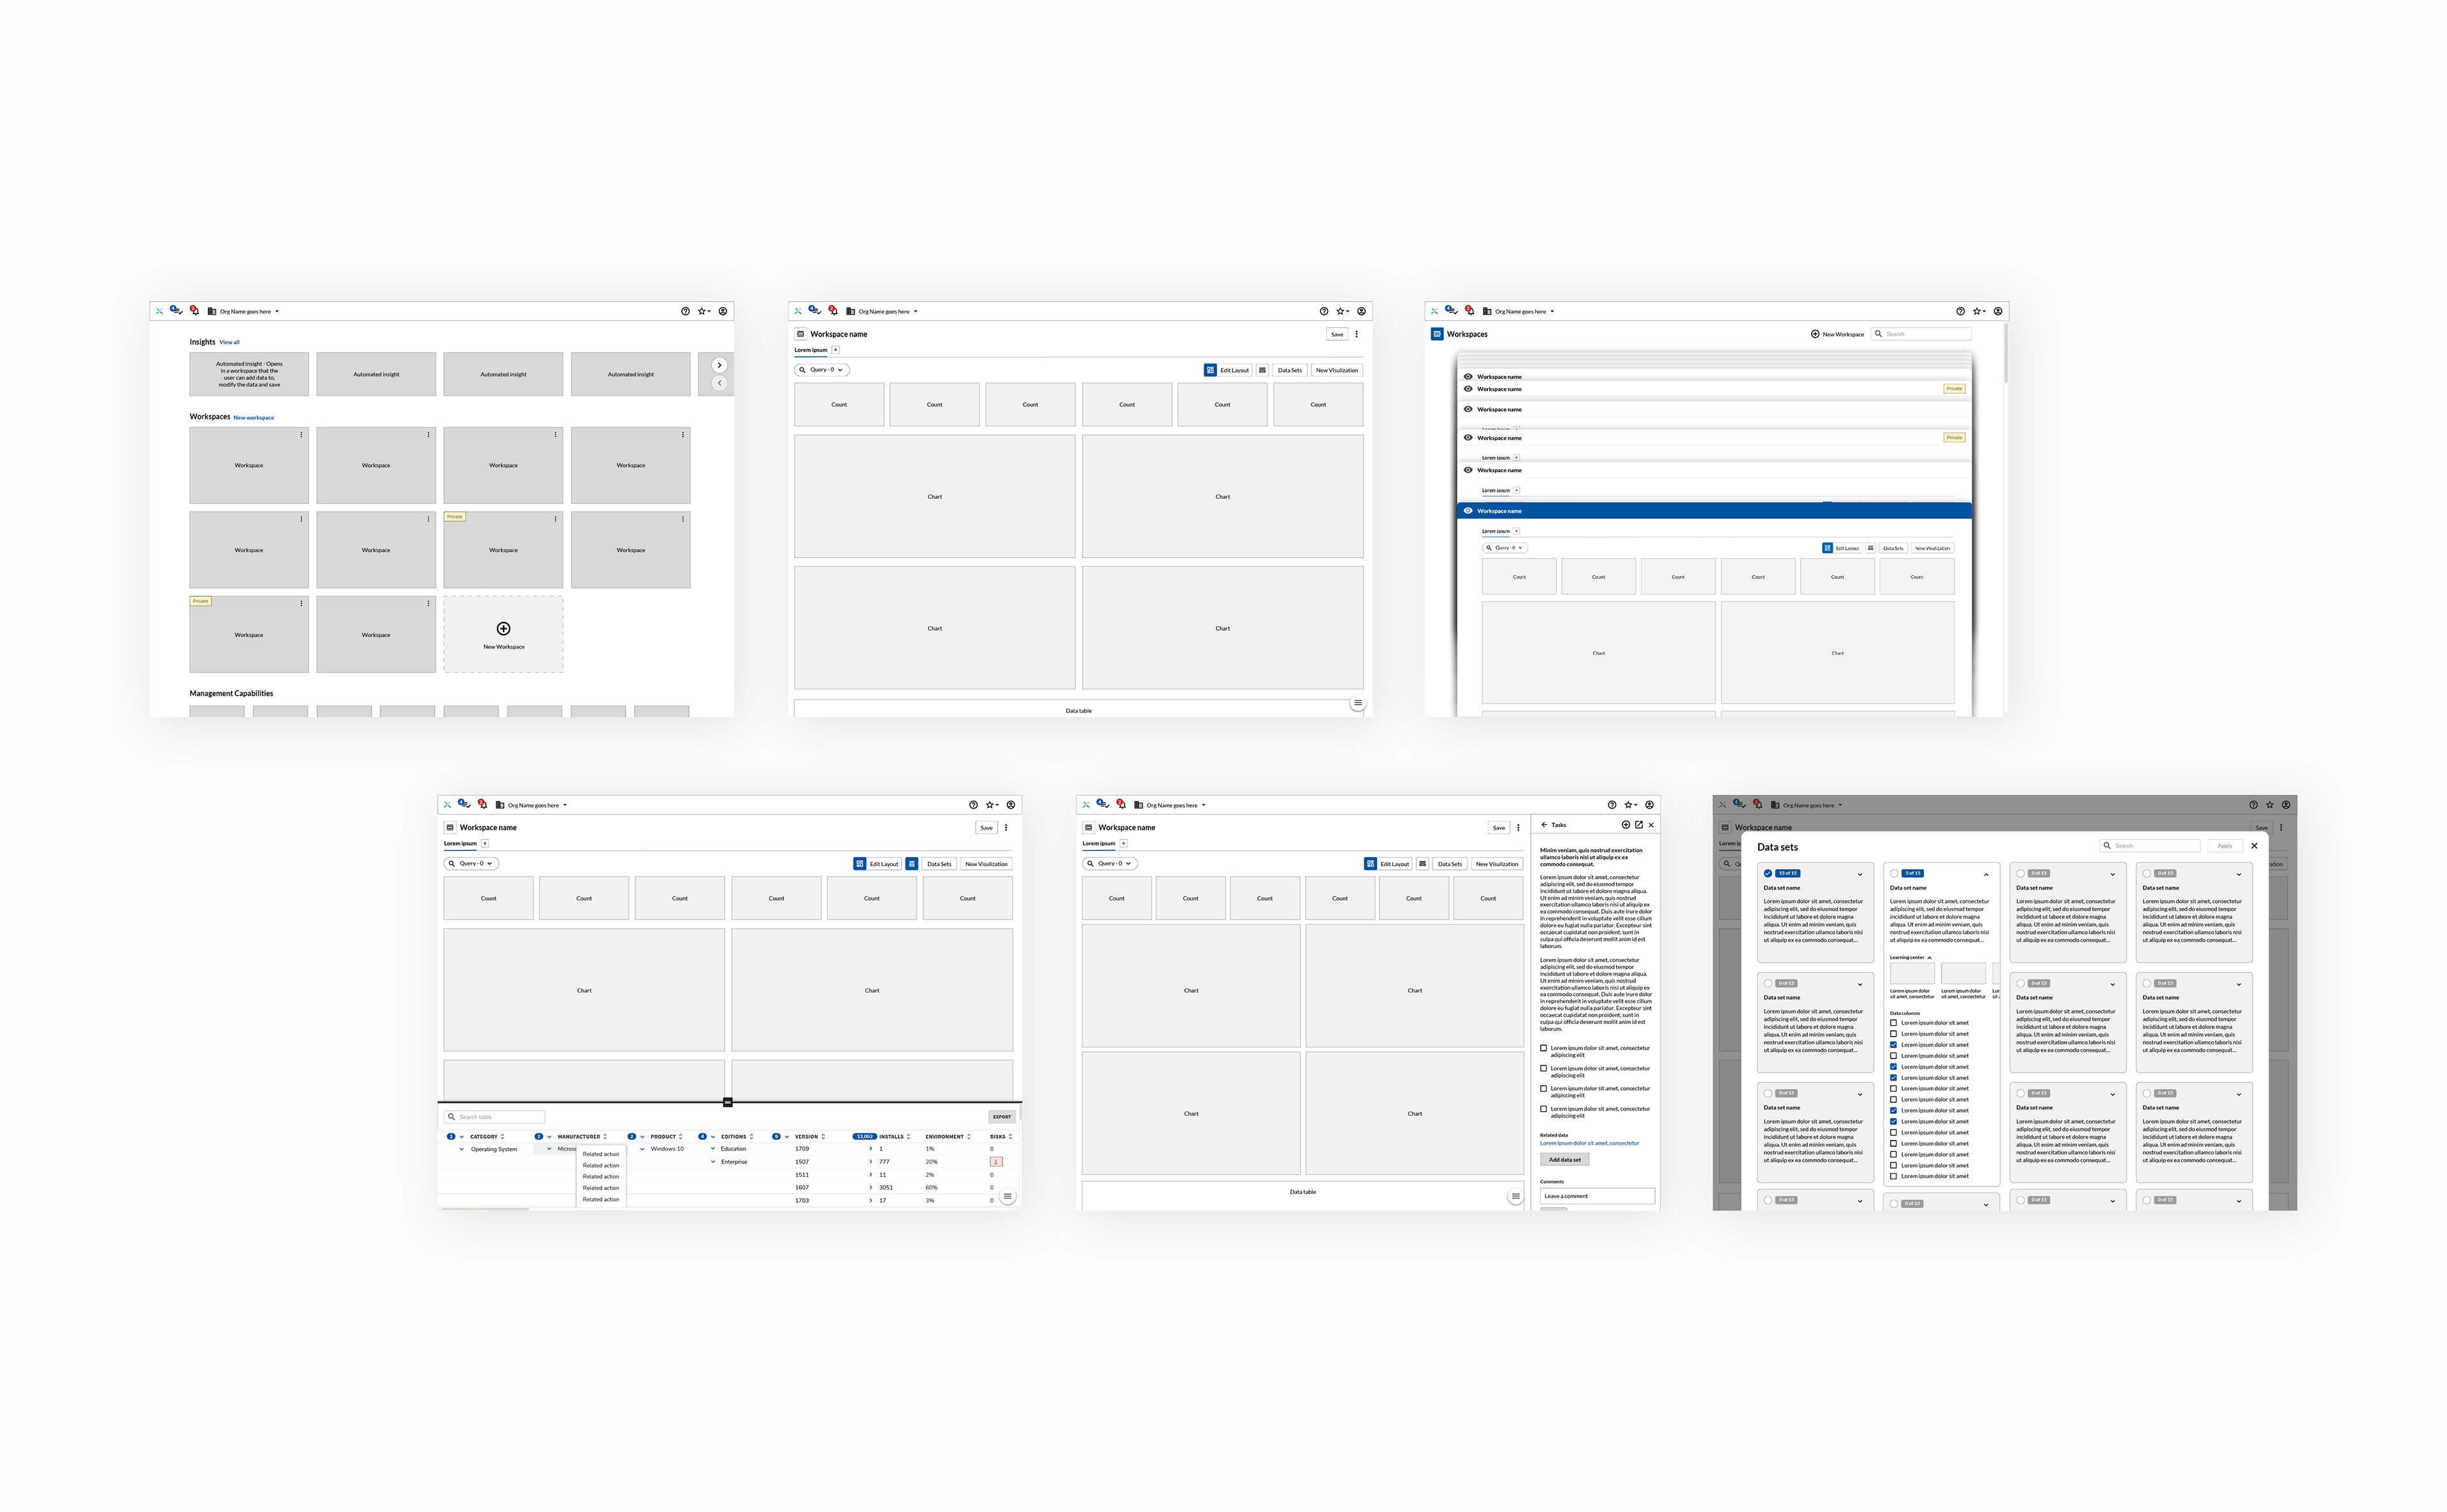
— Final solution —
Prototype 2
Creating a new workspace and importing content.
“You’ve just Wowed me”
(I actually got a "WOW" haha)

User Testing
Value = 4.8 out of 5
Ease of use = 4.5 out of 5
Positive Feedback:
1. Excited and wanted to know when it would be available
2. Loved the flexibility of the solution
3. Loved the idea of having one space to work per use case
4. Customers felt it would save them a lot of time in their day to day and make it easier to identify pain points
Negative Feedback:
1. Dashboard/report creation needs to be simple. Some had experience using other tools and said the learning curve is too steep and that prevented them from using it
2. Need to start with preconfigured dashboards that can be changed
3. Need to see a working example with real data to see if the data being displayed answers their use cases
Prototype 4
Platform navigation integration
Final UI Styling
66% reduction in effort achieved
The new workspace concept succeeded in removing 6 unnecessary steps in the users workflow.

Conclusion
Workspaces is a valuable and powerful solution for users that enables them to boost their productivity, and easily collaborate, manage and monitor their data in real time to minimise their companies IT risks.
It also adds further value to the business by enabling the platform to easily incorporate new products and data sources without the need to build new interfaces. This lowers engineering costs and accelerates the time to value, when new products are acquired and need to be integrated.
You may also like